Research Journal
I think I met a new friend outside my building, too- we got into an animated discussion about Russia and the USSR and stayed out so late that I had to walk her home - she lives in an apartment building nearby. I really hope to see her again - even though she's younger than me, we're really well matched when it comes to knowledge and interests.
Professor Dutta was not feeling well this week, so our meeting was cancelled. However, she sent me an assignment by email: three papers on the subject on seizure prediction and detection to read and summarize. I will be posting their names and the summaries as I complete them.
I took a subway to Brooklyn this week to visit an old school friend of mine. It was really nice to see her again and have fun together like we used to. Brooklyn is really different from Manhattan, but interesting too.
As I'd hoped, Dr. Dutta and I discussed the two papers I had read. She pointed out to me several important points that were particularly relevant to my project. Then she briefly explained some of the difficult equations in the paper I had not understood and instructed me to read it again and summarize it for next week. The main part of the meeting was taken up by an explanation of the basis for my project. Dr. Dutta explained how the EEG data was garnered using a 96-channel micro-electrode array implanted directly in a patients brain (she even showed me pictures of the surgery - gory but fascinating!) and how it is analyzed using windows of a fixed width, say 5 seconds, one window at a time. She also explained how the data is filtered to produce recordings at various bandwidths, each one different. The hope is that patterns that may be missed at one bandwidth may be more obvious on another. We discussed how the data is represented as a table containing the various features that may be useful for classifying it, and the data points at each time interval. She also explained to me the basics of support vector regression and assigned me a paper on Support Vector Regression, as well as one on ROC curves.
At our meeting this week, we got into the details of using SVR on the EEG data. Dr. Dutta explained that the goal of SVR was to use regression to find a line that best divides the data into classes. This is easy if the data is linearly separable (that is, distributed in a way that allows a neat line to be drawn between classes), but our data will not be. In such a case, one uses a kernel function (of which there are several) to transfer the data into a higher-dimensional space (usually higher than can be visualized by humans) where there does exist a clear dividing line, or hyperplane, between classes. To accomplish the goal of finding the hyperplane which leaves the maximum amount of space, or margin, between the classes, the regression algorithm has to find a weight to multiply every data value by which will yield an equation for the maximum margin hyperplane. This is accomplished by trial and error using pre-classified training samples. (Though in our case, the output is a continuous value rather than a simple binary class label.) For next week, I am to start playing around with EEG data, albeit not the dataset I will use in the end. I will be posting my progress as it occurs, and am excited to have some real programming to do - no more papers!
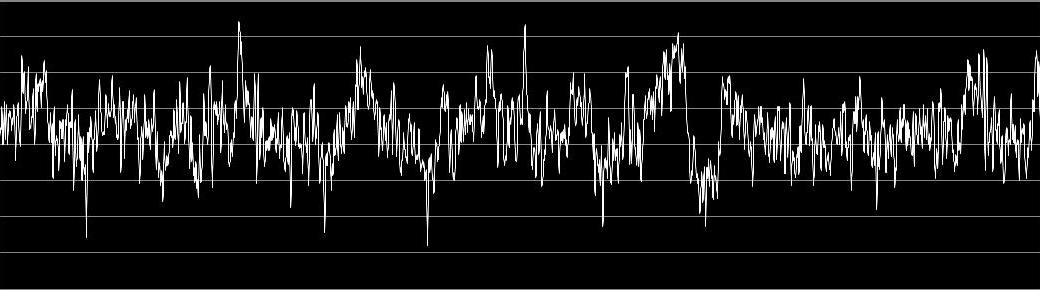
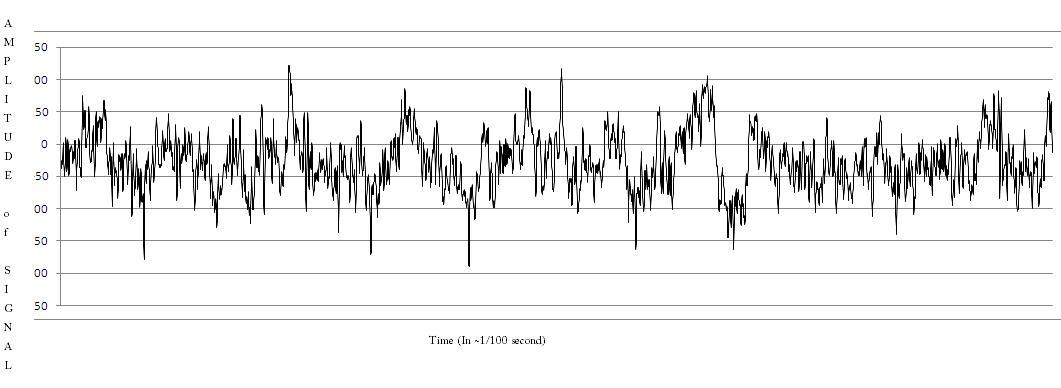
This week, I finally was able to do some programming! I downloaded a zipped folder containing 100 text files, each with 4096 data points from an EEG, from the University of Bonns website. This still is not the data I will be working with, but its close enough. I copied one files worth into MS Excel and used the graph-making function to turn it into a line graph. It looked like a real EEG! Here it is:
 I then wrote a file-processing program in Java (it was nice to be back working in my native tongue!) to turn the simple text file into a .arff file that could be used by Weka.
Since this was just a practice, my goal was to see if, knowing a set number of data points on an EEG, could the software accurately predict where the next point would be.
I then wrote a file-processing program in Java (it was nice to be back working in my native tongue!) to turn the simple text file into a .arff file that could be used by Weka.
Since this was just a practice, my goal was to see if, knowing a set number of data points on an EEG, could the software accurately predict where the next point would be.
Since there are 4096 points, I split the data into 512 groups of 8 points each and labeled the first 7 points of each group as attributes, with the last one being the class label (really a continuous value, as used in SV Regression.) Then I opened the file in Weka and experimented with various ways of splitting the data between training and testing sets, as well as with different values for the C-value, a measure of the size of the margin set between support vectors. Using root mean squared error to measure my results, I got the best results using 70% of the data as a training and 30% as a test set, with a C of 10. The full results can be viewed here .
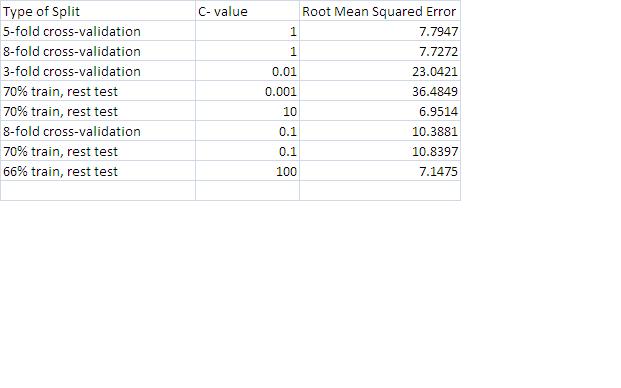
After spending a short time discussing my results from last week, (they were pretty self-evident) at our meeting, Dr. Dutta finally began explaining to me what Granger Causality, which has been piquing my curiosity as the title of my page for a while, is. It is basically a measure for determining whether one data set, in this case one channel, influences another. The way this is done is by using data values from two channels and seeing if the class label is predicted with better accuracy than when using only one channel, as I had been doing until now. If, for instance, if I achieve better accuracy using data from both channel 1 and channel 2 than I had for just channel 2, that means that channel 1 is affecting channel 2. If not, it means that 2 is affecting 1, or that the two channels are independent. My assignments for this week were to read the papers on Granger Causality listed below, and to run tests using two files from the Bonn data to see if one channel affects the other. Dr. Dutta said that not much work has been done on using SVR with Granger Causality, so if I get significant results, my work might be publishable. Definitely an interesting thought.
I really had a nice time this weekend! One of the girls from the lab invited a group of us to her parents' summer home in upstate New York for a long weekend. We took long walks in the country, picnicked near the lake, and barbecued on the lawn. There even was a fireworks display nearby! I love the country - just being around grass and trees relaxes me - so I really enjoyed the weekend and came back refreshed and ready for another week of work.
I admitted to Dr. Dutta at our meeting that I hadn't read all the papers she had assigned; it was a short week and I was still having trouble with the mathematics, so I read only the parts of the first two that she had said were most important. She graciously explained to me what I had not understood; namely, the algorithm used to apply Granger Causality to a time series, such as the EEG records I am working with. I didn't quite understand it, and hope that she'll explain it again before I need it...
We discussed my test results from last week and agreed that they were pretty inconclusive; however, as Dr. Dutta pointed out, that does not mean that this line of research is not worth pursuing. It could just mean that those two channels had no effect on each other. Then Dr. Dutta assigned me the project I had been both looking forward to and dreading: running Granger Causality tests on all combinations of two files in the data set. Since there are 100 files, that means 100
I took a bus downtown one day this week and went shopping. I got some great deals on all sorts of things - it's hard to beat New York City stores!
I ran into problems right away. I easily found the jar file with the Weka source code, but had difficulty unpacking it. After much back-and-forth with a programmer friend, I managed to unpack the jar and import all 150+ classes into a new package. I know that 150 classes is not much for commercial software, but I had never worked with more than 15-20 at a time before, all of which I had either written or had at least a rough idea of what they did. Here, I was totally at sea. The package names gave me some clues, but not enough. I figured out that I probably needed the package entitled "weka.classifiers.functions.supportvectors", but other classes that I needed were not so clearly labeled. Even the ones that did have clear names were confusing: there was an SMOReg class in the weka.classifers.functions package, which inherited from Classifier, which sounded right, but there was also a RegSMO and a RegSMOImproved, which inherited from RegOptimizer, in the functions.supportvectors package! Which one was the right one? How did I use them? They seemed to contain mostly methods for displaying tooltips, which I didn't need at all. I managed to find buildClassifier and classifyInstance methods in two of the classes, but I couldn't figure out which class called those methods. After several fruitless hours of searching, I was desperate. I emailed Rivka, Dr. Dutta's other DREU intern, since I knew that she had also had to modify Weka code, and asked her for some pointers, but her experience wasn't very relevant to mine. Dr. Dutta wasn't able to help much from afar, and I was at my wits' end. Then I had a break: I found a class called Instance which contained methods for loading a data set from a file and preparing it to be processed. The class had some sample code in the comments, which I copied into my modified file-creation program. After some tinkering with the various SMO classes, I finally emerged with a program that worked! It looped through all the files specified, created all permutations of one-and-two-file combinations, and ran each one through an SV regression algorithm. Then it calculated the variance and output the results to the console. After spending so much time debugging - stepping through code step by slow step - I almost forgot how fast programs execute - my program creates several new files and prints out thousands of lines - all in a second or two! It seems almost magical.
At our meeting, Dr. Dutta and I discussed my program and agreed that my work for next week would be to improve it - make it print out the results to a CSV file that could be easily transferred to any program that could produce a color-coded matrix - a neat visual output that would make things easier to understand. I also have to work on generalizing my code - right now it only works with data files in a certain setup, with a set number of attributes, etc. I am to make it customizable, so the layout of the data files, the size of the window, (that is, number of time-series values used for each prediction) the c-value, etc. can all be changed by the user. I have also resolved to optimize my code - I was embarrassed by the clumsiness of my code right from the beginning, and would like to make it more elegant and streamlined. I think it is particularly important because I am using Java, which runs more slowly than other languages already. Once I start using large numbers of files, just running even optimized code will take a long time - I'd like to make sure that my code is not slower than it has to be.
Dr. Dutta also explained to me that the measure I had been using - the variance of the error - was not the final measure we need. What I really should be calculating was the equation for Granger Causality. It involves taking the natural log (ln, or log of e) of the sum of the squared error of a channel, divided by the squared error of that channel combined with another one. It shouldn't be too hard to implement.
I was extra busy this week because a professor asked me to tutor one of her students who was having trouble with a programming course. I really enjoyed doing it, though teaching someone else how to program was much harder than I'd thought! We worked through several assignments together and discussed concepts like inheritance and polymorphism. I taught her how to use the Java StringTokenizer and file processing classes, and she introduced me to the Calendar and DecimalFormat classes. You learn something new every day!
As I had expected, it wasn't too difficult to modify my code to allow for customization. I did, however, encounter difficulties when trying to use a window size that resulted in some data values being left over; Weka threw an exception that I couldn't figure out how to fix. I'll admit that I ignored it (on the next modification, it somehow got worked out on its own) and went on. I made the window size, number of data values in each file, and c-value all customizable. Then I ran my program on 15 of the 100 files and imported the resulting csv file into Microsoft Excel, where it made a neat 15-by-15 matrix with all values above 0 highlighted.
At our meeting, Dr. Dutta was very intrigued by my results. While most of the Granger Causality values were negative (that is, no correlation) or very low, there was a small block of 4 or 5 pairs that were high. All in all, the results looked promising, and Dr. Dutta asked me to run my program using all 100 files. Since that would mean generating 10,000 new files and running them through extensive processing, we decided to run my program on the server rather than overload my computer.
I also continued working on this website. I had originally hoped that my blog page would be a good enough record of my internship, but for various reasons, that didn't work out. I finally found hosting last week, but ran into some problems. I couldn't figure out how to ftp my files over to the server, and the supposedly graphical ssh client I downloaded only gave me a command line. I also had problems with my css files; I've done web development before, but can never manage to get the css to work exactly as I want it. My website ended up being a group effort: one graduate student let me use a computer with a graphical file-upload tool that was incredibly easy to use, and another, a really great web developer, helped me with my css issues. (I got a tutorial on using firebug, which I'd tried with little success before, so that was an extra benefit.)
Once I had all the files uploaded to the server, I tried running the program. The server doesn't support the javac (compile) command, so I had to upload my already compiled .class file and run it from there. After spending a long time trying to work out path issues, I finally got it working! It was really exciting to watch the numbers zipping across the screen. As we'd expected, it was really computationally heavy - depending on the window size and c-value, it could take between half an hour and two hours (!) to run! After a while, I got tired of sitting and waiting for it to run, so I modified my program to accept command line input and wrote a shell script that would automatically run the program several times in a row with different inputs each time. This way, I could leave it running for hours on end and do other things meanwhile. The only problem was that the program terminated if my connection to the server was cut off in any way - if I lost Internet connection for a few seconds, or my laptop went onto standby. Because of that, I did have to sit over it, but at least I was free to work on my other project for the week: compiling a bibliography of related works on Granger Causality, particularly as related to EEG's.
Dr. Dutta wanted me to create the bibliography in Bibtex, the bibliography part of Latex, a standard type-setting markup language used for academic papers. I wasn't sure I could do it, but my roomate had been working on converting one of her papers to Latex, and the Bibtex part of it didn't seem so hard. She introduced me to Citeseer, a website where you can search a database of research papers with the Bibtex entries provided on the side. Citeseer didn't have everything, so I also used Google Scholar, which also searches research papers, but seems to me to be more comprehensive. Every paper I looked at seemed to lead me to three or four others through its citations, and I soon had nearly 20 open tabs on my browser which took me days to wade through. My bibliography is definitely a work in progress - pretty long already, but nowhere near finished.
As for the lesson - there I was, going my merry way, with my program humming along and producing neat output, hoping to have some promising results to show Dr. Dutta, when debugging an error in my program made me notice a minor inconsistency between the website's description of the data and the actual files. Puzzled, I emailed the contact on the website and was told, (paraphrasing) "It's not a big deal, but why are you using our data for Granger Causality analysis. Our data is univariate, and for GC you need bivariate data." Well, to make a long story short, the data we were working with was not actually recordings from 100 different channels from the same patient at the same time, but rather random samplings of different patients that had no connection to each other. So all the results we had gotten were total nonsense, and all that work went out the window. Well, not really, because hopefully my programs are easily adaptable to another dataset, so I'm actually more amused (the idea of us solemnly discussing our "promising results" when they were really nothing strikes me as rather funny) and grateful (that it was discovered before we went further with it). We decided to switch to using the University of Freiburg's dataset, if it fits our requirements (and you can be sure that I'll check this time!), and I learned a rather strong lesson about the importance of checking everything before starting and not relying on others. As an undergrad with no previous research experience, I'm used to teachers verifying everything before assigning a task to students, and had assumed that Dr. Dutta would have done the same here. As I found, that's not the way research works. Dr. Dutta had no prior knowledge about the dataset and expected me to evaluate everything very thorougly. This misunderstanding has really taught me something about research that I've heard before, but never really appreciated: nothing is spoonfed to you. Often, your mentor or advisor knows no more about your specific research than you do - you have to do all the work alone. It's a pretty scary thought, but somehow exciting as well, and this experience is definitely one that will help me in graduate school!
I really enjoyed my experience this summer. It gave me a taste of what research is like and what it feels like to belong to the scientific community. It really gave me the confidence to enter a PhD program in September with the knowledge that I enjoy academic research, and can't wait to get involved in a long-term project!