Visualizing Hairpin Vortices in Turbulence
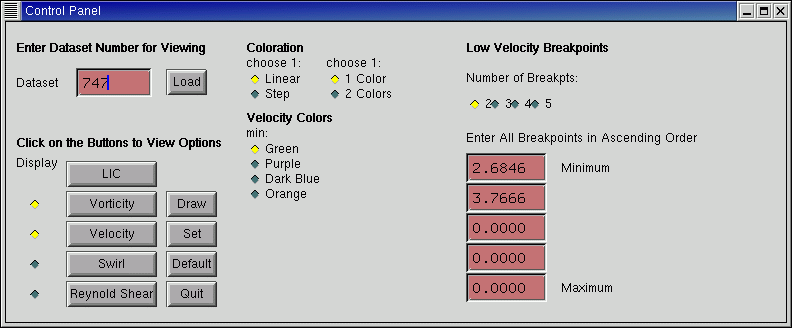
The main focus of my job was to create a user interface. My first step involved learning how to use MUI, a OpenGL toolkit for C programming. After installing MUI and creating a few buttons I was well on my way of developing a user-friendly interface. Some of the features I included allow the user to specify what measurements should be displayed and how they want to display them.
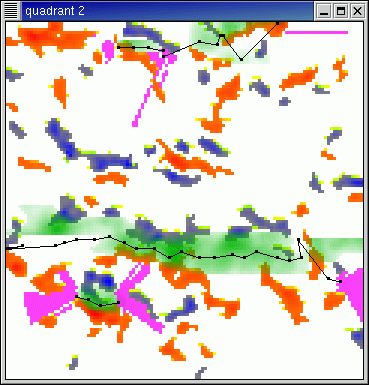
The following is a view of the interface displaying the vorticity buttons and the resulting visualization:
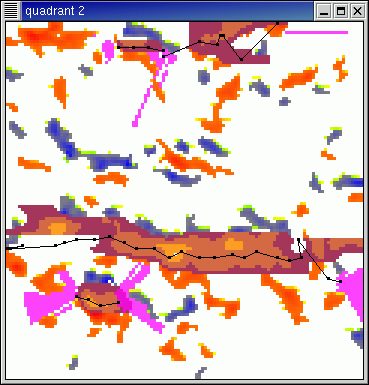
These next figures display a different option involving the same vortices patches. The pixels between different breakpoints are well defined.
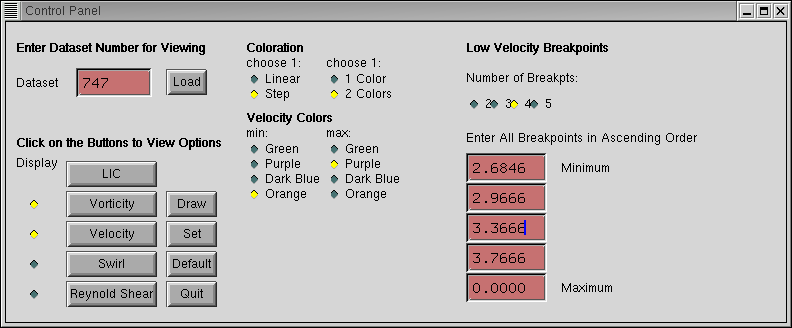
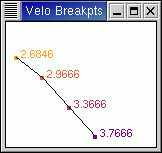
On top of the interface I made the program event-driven as opposed to the previous version where there was no input from the user. The program is documented and there are comments in the code so that future project members will be able to further develop the program with ease.
Due to time constraints I was not able to complete a few options for displaying certain
measurements. It would also be nice to develop a better way to decide wether or not to
display the marker on each swirl or Reynold Shear Stress patch. A large amount of time
was spent attempting to find the cause of an irregular segmentation fault which is yet
to be resolved.