Journal
Week 1: Preparation
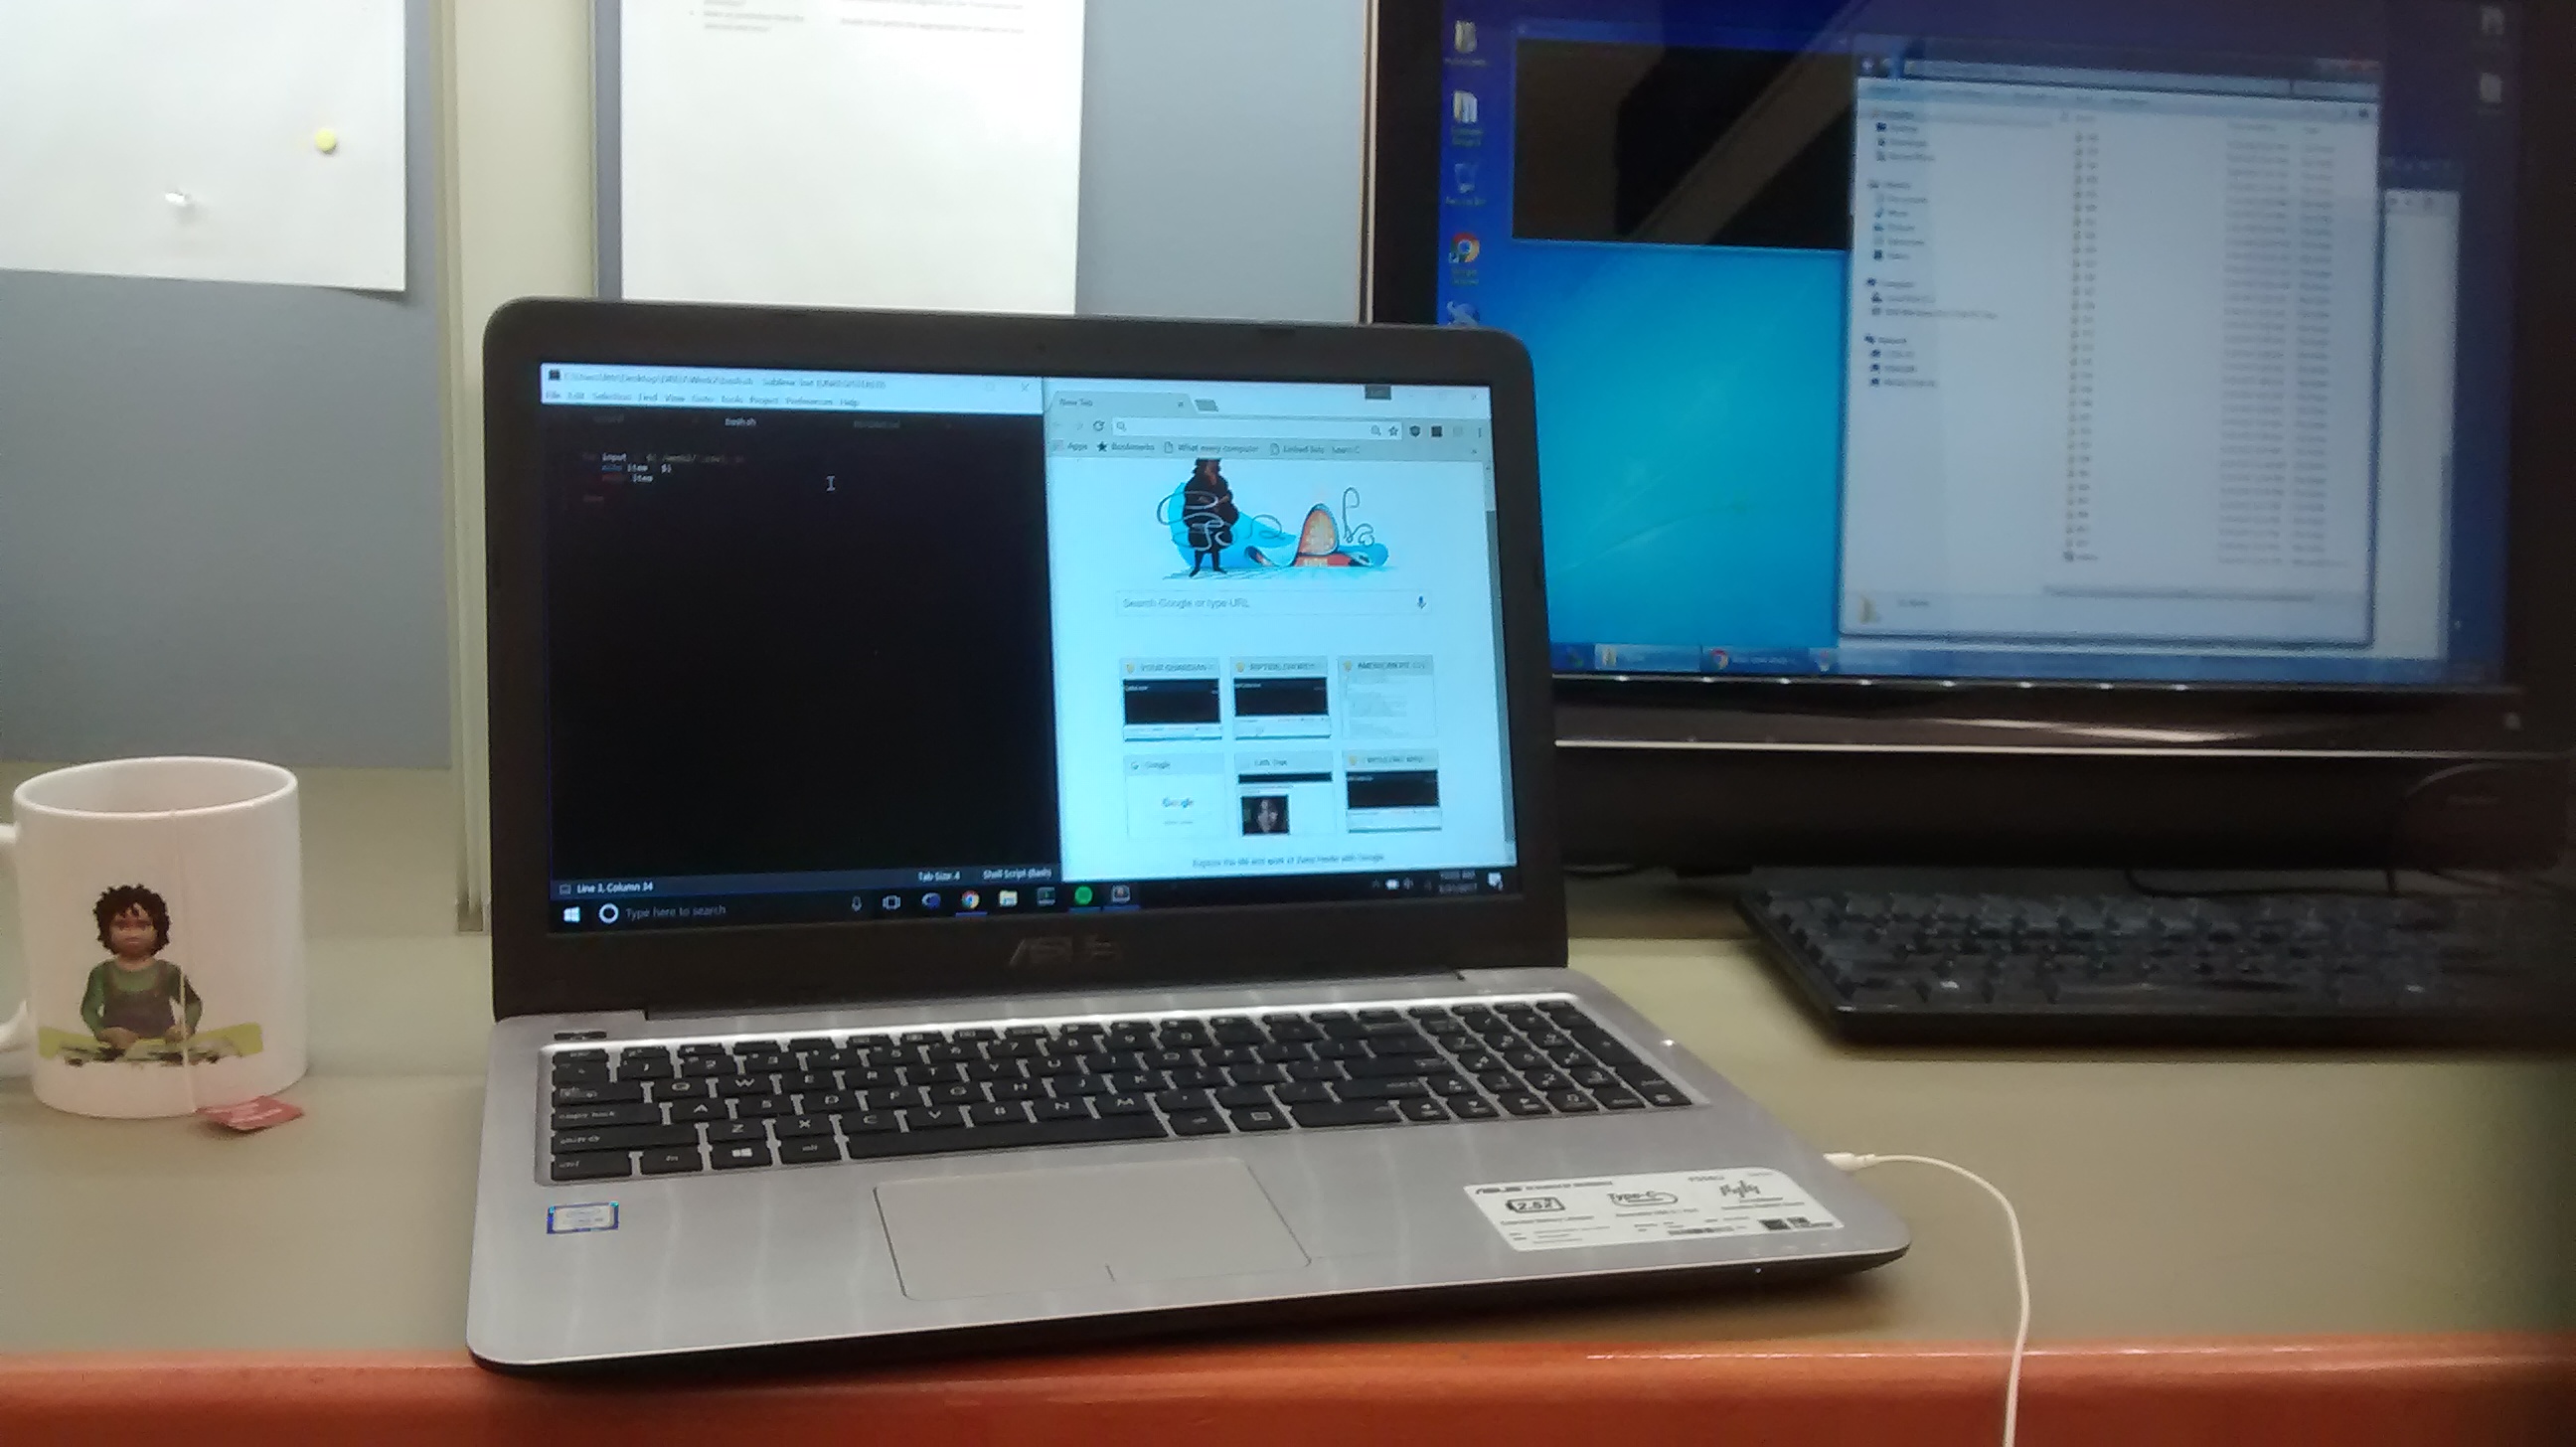
This week was hectic, but I am glad I had managed. My first day of work started on Monday, May 22. The first day I managed to get to the ArticuLab just on time after learning how to navigate Carnegie the day before. I first joined the orientation meeting hosted by Laruen Smith, our lab manager. We were seated and given a folder with information about how to start the first week in our lab. Some of the forms addresses the common rules and obligations that we must follow while working in the lab. We went around and did a self-introduction. I learned that most of the interns will be working in the lab part time on the Alex project like me. Most of them were students from the University of Pittsburgh taking the internship as a credit course for their Linguistic major. I spent the day reading the articles about the research such as Samantha's proposal for her dissertation, readings involving cognitive learning using adaptive learning technology and how they influence children learning and development.
The project focuses on measuring and identifying specific factors that interfere with children who speak the African American Vernacular English performance in science, rapport, and socio-cultural interaction. The main contribution of the project is to illustrate how dialect impact students' science performance and how technology could be adapted to improve that outcome. The primary focus for me this summer is to act as the agent that cohesively combines all the interpreted data obtained by students who transcript them, rate the levels of rapport, reasoning, science discourse that base on the social and science aspects. Thus, I spend most of the week reviewing statistics topics, working with R by learning its syntax, and coding using the program. Some of the things I reviewed were hypothesis tests, p value, null \& alternative hypotheses, examples of hypotheses, effect size, differences between variance \& standard deviation, confidence intervals, what is consider a large enough sample, and between subjects vs. within- subject design.
Aside from the work, I was also able to attend two lab meetings. They help me become more acquainted with the type of work I will be doing such as how to analyze data and interpret data sets to come up with hypotheses. I learned the value of collaboration and discussions on how to review a paper for conference submission. I am happy to have the chance to formally meet everyone in the ArticuLab, especially Dr. Justine Cassell. She is very knowledgeable about writing papers for conferences and research. I am happy she brought us donuts for the meeting as well! I am grateful that everyone is friendly and easy to talk to. Lastly, I am happy to be working with Samantha who is very friendly, enthusiastic about the research. I am delighted about the amount of efforts she puts into guiding me, corresponding with me, and answering any questions I have about grad school.
Next week I am expected to do more review and statistics, come up with 2 hypotheses using the new list of data from Samantha, elaborate on the motivations of both in a paragraph for each; and read more articles about critical race theory and topics related to the Alex project. I expect that I would be more adjusted to the full-time schedule of work and start producing work that is substantial that help with analyzing the data for summer.
Week 2: Getting Started
This week I was more familiar with the campus and has already adjusted
to the work schedule. Initially, my goals week were to do more reading about the
critical race theory, educational technologies; come up with two hypotheses
involving the data collected; review statistics and R programming.
The Alex group is split into three main groups: transcribers, social team, and
science team. The transcribers will listen to 30 seconds videos clips of the
kids interacting with Alex. The social team are supposed to rate the level of
rapport using a random sample of video clips. Their way of making sure that the
ratings are reliable they will compute the coefficient variation. Lastly, the
science team are responsible for looking at the transcripts and detect for
science discourse and reasoning. An example of this is demonstrated when a child
describes the diet of an animal based on the habitat it lives in.
Good news was that I finally got my student ID to get access to "Box" which is a
file manager that allows the lab to upload and share files securely. I logged in
my hours for the past week.
The thing that took most of my time was finding an efficient solution to helping
the Social Team select random files to do their ratings for data collection.
Initially, they would hand select the files they had to rate and keep track if
the files they looked at.
I solved the problem by breaking it into two parts:
1) Write a R script that splits the files into groups
2) Write a bash script that copies the files into their designated folders.
This task took a while because I wanted to take the opportunity to learn how to
read and parse files in bash and R. The only thing has yet to figure out is how
to call a RScript inside a bash file. I learned that I would have to change the
PATH to link to the R executable file. This will eliminate the process of having
to run both scripts independently.
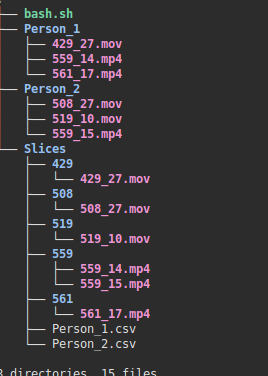
The R script is run first. It randomly selects sets of .mp4 files and
put them into separate lists. Each of those lists are written to a separate .csv
file. The R script makes sure that all the lists are of equal size. Then, the
bash script will run and select each of the files by name from the path
directories they are located and placed them in a single folder. The following
image explains the structure of how the files are placed.
On Friday, I discussed my accomplishments and goals
with Samantha. We spoke how I should split up time to address how I
should analyze data, practice R, and do article readings. I am glad
we addressed that because I had trouble organizing my focus. We
discussed about an upcoming conference the
2017 AERA (American Educational
Research Association) conference and the opportunity to submit
papers to it. This is exciting because she offered to help me prepare a
paper for the conference. Ideally, this paper will also become my final report.
To do that I will have to come up with hypotheses and interesting questions to
test and to write the paper by the beginning of July.
My goals for next week are to:
- Brainstorm ideas, hypotheses, look for AERA papers
- Draft of the progress report by Wednesday and review with Samantha on Friday.
- Attend the R programming class on Tuesday.
- Reading more articles and papers.
Week 3: Working with Data & Learning Statistical Mediation
This week I accomplished these things:
1) Attended the First two session of
Dr. Howard Seltan's - PIER Statistics Courses
Statistical Mediation in Education Research (Summer 2017) .
The class is a three weeks class and meets on Tuesdays \& Thursdays from 11-12:30
a)
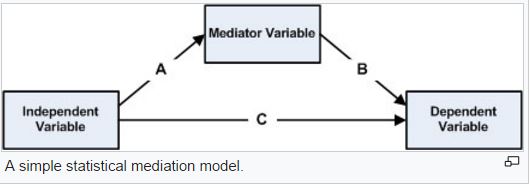
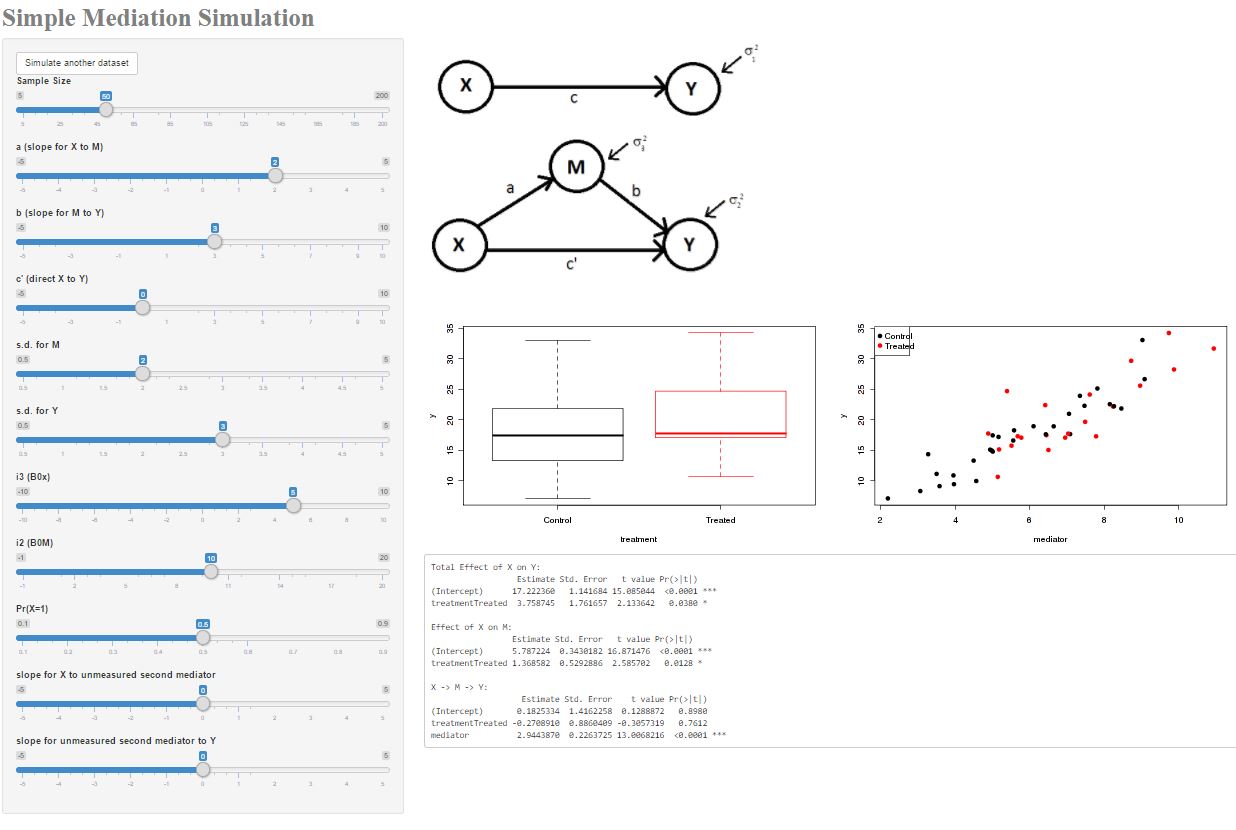
Mediation- In psychology we need to us mediation to show cause and effect. The model's purpose is to show the relationship between the independent and dependent variable through a third hypothetical variable, mediator variable.
b)
Causality - most clear \& concise definition mean (all the active subjects) - mean (all of the control subject).
c)
Baron and Kenny Mediation approach requires three separate regressions. I learned about the difference between partial vs. complete mediation.
Moderator vs. Mediator variable -moderator determines the strength of the relationship between two other variables and the mediator explains the relationship between two other variables.
2) Completed the DREU Progress Report and discussed it with my graduate student mentor.
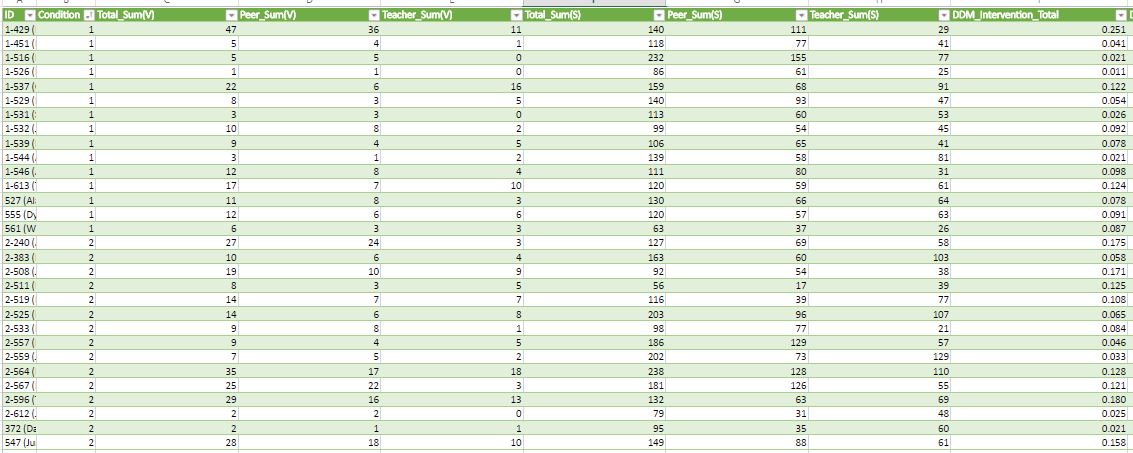
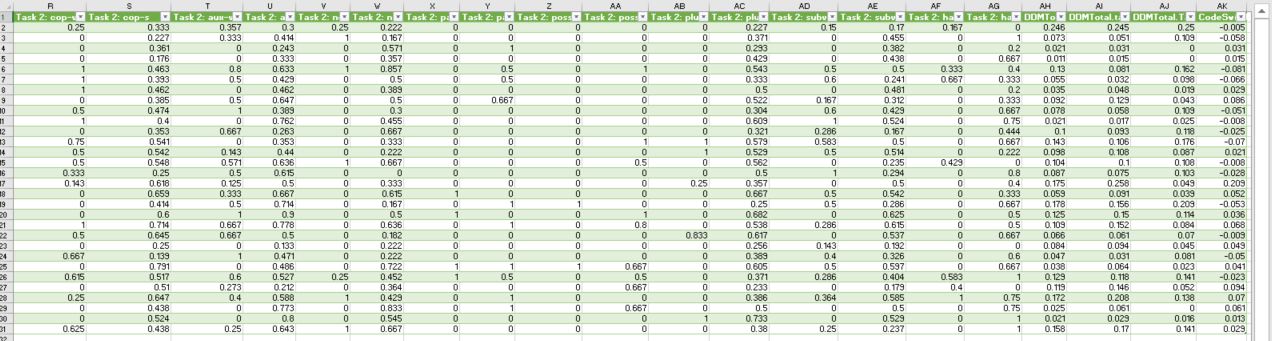
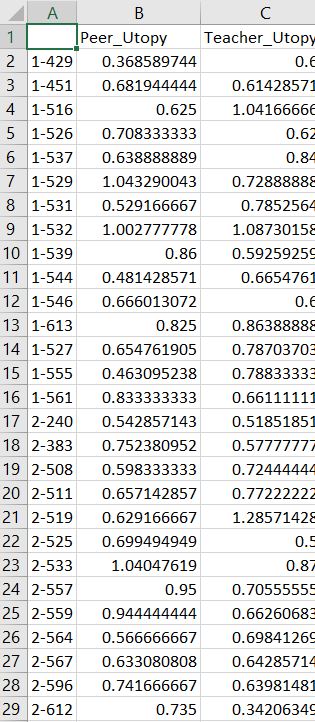
3) Worked with calculated
Dialect Density Measure for the annotated data retrieved this summer. DDM counts for grammatical dialect speech patterns exhibited by a speaker for instance the frequency of various parts of speech like 'pronouns'. Had to account for two scenarios in which the participant spoke vernacular English labelled as the 'peer' and 'teacher' task. We calculated the difference between the two DDM and retrieved the percentage of context switch e.g (peer DDM - teacher DDM).
The percentages are interpreted as follows:
DDM > 0%, participant code-switched in peer > teacher task
DDM = 0%, they have the same amount of code-switching.
DDM < 0%, no correlation of code-switching and scenarios.
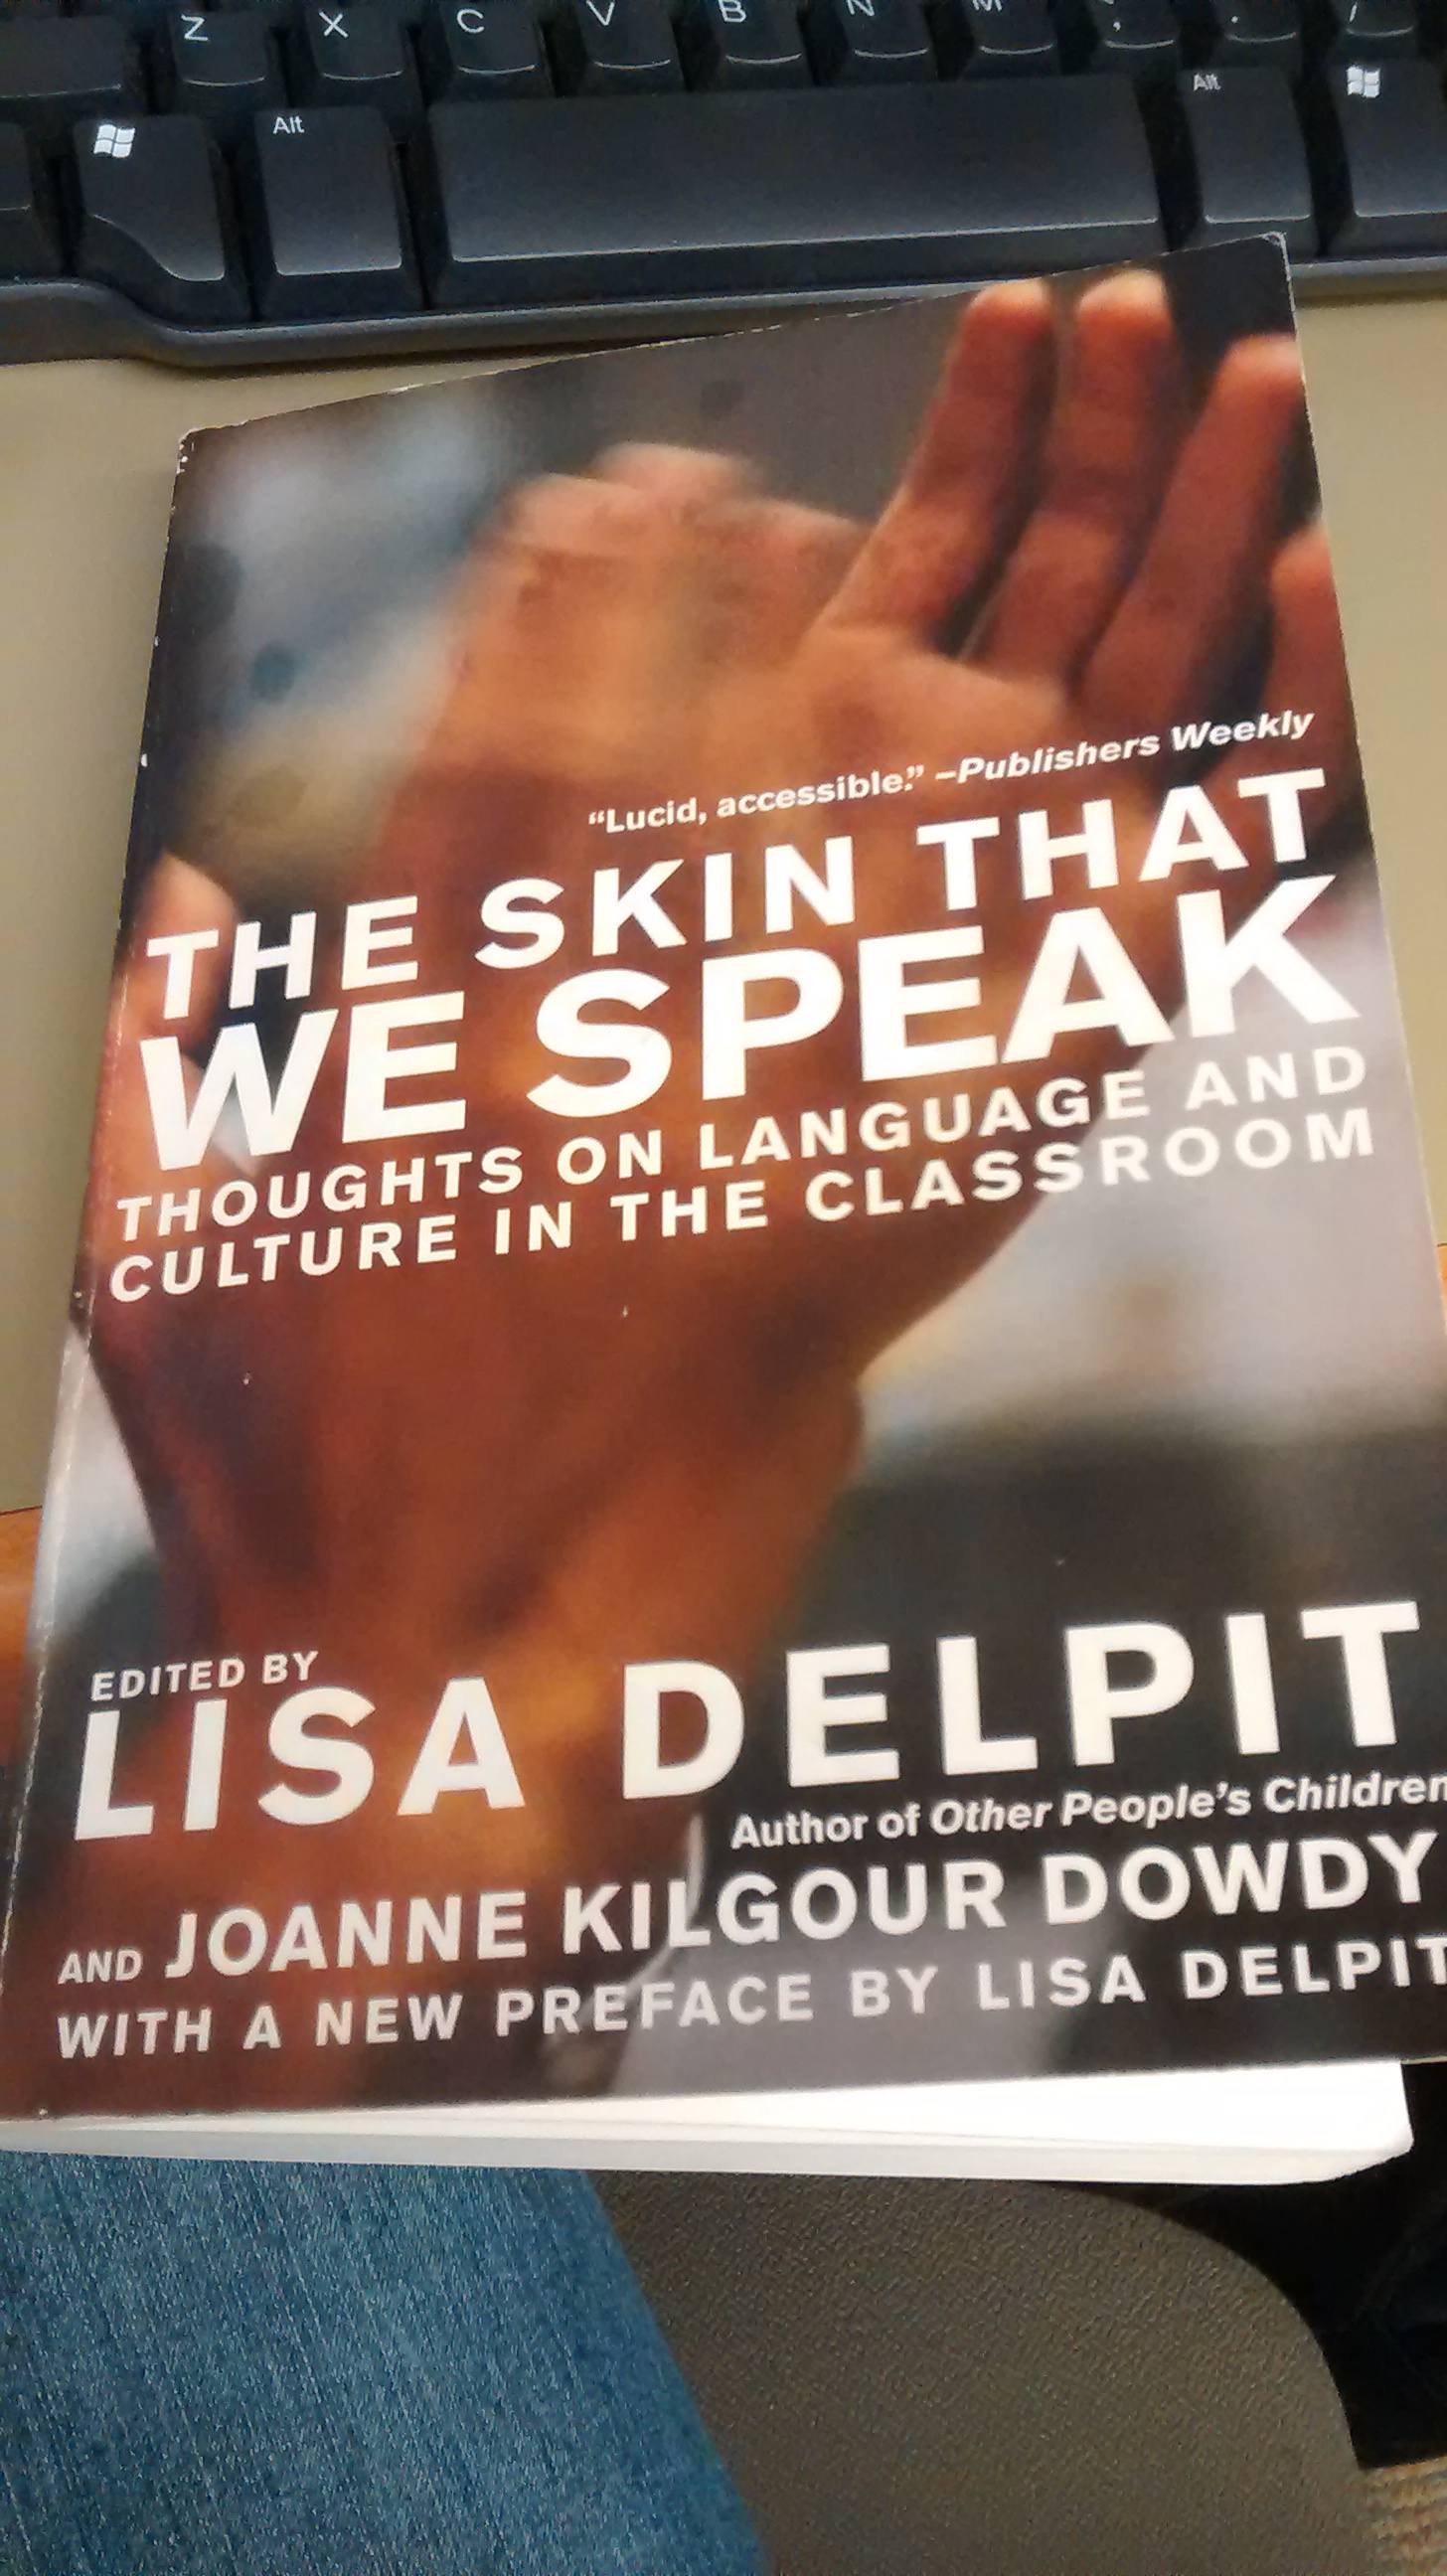
4) Read the book
"The Skin We Speak" by Lisa Delpit. The book is very inspirational and exbibit various perspective and stories about how people react against discrimination about the language they speak. One of the most memorable excerpts was about Joanne Kilgour Dowdy. I really relate to the person's story because she had to overcome the fear of fulfilling two roles in her life and finding the proper balance between speaking her native language and the British English correct way. I struggled with the ability to connect with my heritage and culture; I struggle with communication with my parents. Can we sense the disconnect that kids have with their culture today if they grew up being 'Americanized'?
I learned about the revolution of the
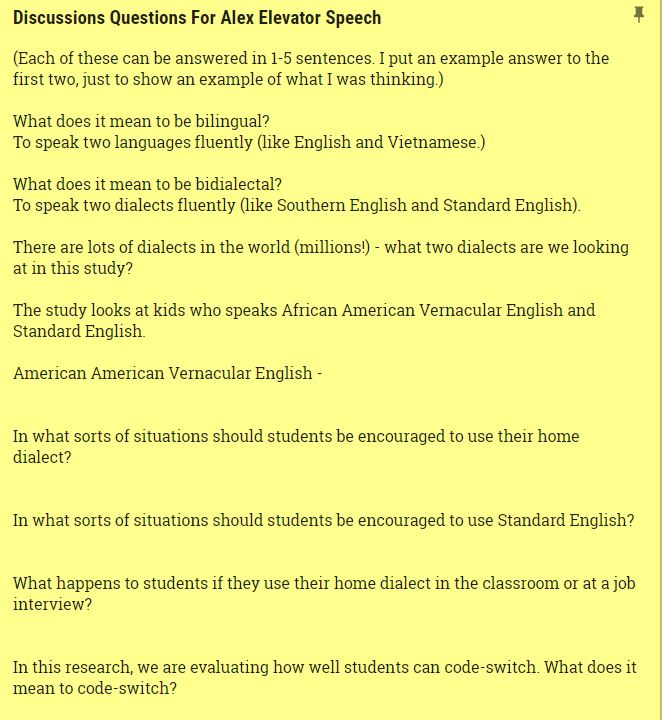
'Ebonics Debate' had on the field of linguistics and the turning point that caused much upheaval in mass media. Therefore, it serves as an example of how controversial the matter is the communities that had to struggle with discrimination. Today more research is being done to address the concern about why African American children should learn their native language. I find my project to be powerful because we want to address whether it is better to encourage children to code-switch between dialects in a school setting; they can use code-switching as a skill that progress the way they perceive the way and learn. Nowadays, we are focus on building more artificial intelligence that are more human-like but neglect to address ethical concerns about how it influences social beings. We must study the social aspect of how they are design visually and interactively.
5) Participated in a reading group meeting. The reading group meetings are meant to help undergraduate interns. Discussions are built from related literature assigned bi-weekly and the meetings
are held every Thursday from 4-5pm. The first half is meant to be for weekly updates about our progress in the projects, goal, or challenges we faced. The second part are hands-on activities
that are like workshops about topics such as how to improve our CVs, personal websites, delivering elevator pitches. This week we discussed an article written about racial discrimination in the video game, World of Warcraft.
This paper relates to the Alex project between we can see how a population people in the virtual game share the same problem in racism discrimination. We learned from the discussion that as computer scientist that we must acknowledge and address the ethical problems that comes with our creation. Virtual stimulations allow us to can observe and test how people react and interact in a controlled environment. During the elevator speech workshop, I learned that we need to identify 1) Audience 2) Goal 3) Why they are situated now and where we want them to be. Identifying these key goals will make it easier for me to deliver a elevator speech.
My goals for week four are to continue my study with Dr. Seltan's Statistical Mediating course by reviewing his notes and reading selected chapters from his book; read the skin we Speak; develop hypotheses to that correlates with the data that is collected. I hope to have a better foundational knowledge about my project to deliver a good elevator speech to my peers on Thursday.
1)Learn about regression, difference between logistic vs. linear regression
2)Go through Dr. Seltman Book website chapters ANOVA \& regression
3)Read book + Statistics class => hypotheses to test with data
4)Also, I am looking forward to participating the 'Virtual Undergraduate Town Hall: Planning Motions for Robotics, Crowds and Proteins' webinar for DREU on Tuesday, June 13.
Week 4: Writing R scripts to Compute Dialect Density Mesures
These are the things I accomplished this week:
1) Uploaded Week 3 Progressproject
2) Learned about logistic vs. linear regression
3) Went through Dr. Seltman's Book and Website on ANOVA regression
4) Attended the Mediation Statistics Class
5) Modified the script to calculate DDMs for each grammatical features
6) Miscellaneous tasks such as exported data files to make format
necessary for data analysis
This week I learned a lot about
data processing using R. The reason for
processing it in R is that we already using R to perform data analysis so it is
convenient and easy transition for both the data analysis to be done in the
same platform. I am aware that it is easier to perform data manipulation using
SQL because it is quicker and not RAM memory heavy and I haven't really worked
much with SQL to make further judgement. Despite those pros, these are the
things I like about R:
1) Vast packages and libraries that could be easily imported
2) Good interface that displays the imported data
3) Good for doing statistical analysis with the existing
libraries that are created for that
purpose.
4) Interactive each line of code is interpreted instantly line by line
which makes debugging easy
Logistic vs. Linear Regression: These are two types of statistics tests used to
make data analysis. In data analysis, we want to know the impact that independent
variables (e.g. What is the impact of percentage of code-switching have on a
child's ability to reason in science.) Those two models are used to evaluate the
relationship between independent variables and dependent variables.
Linear Regression is a type of
general linear model. It is equation whose
dependent variables when plotted creates normal distribution. Ex. Illustrating
how number of frequency of science words mentioned by a child predicts the
amount of science of reasoning the child utilizes in a conversation.
Logistic Regression in contrast is a
generalized linear model that is a sub
category of general linear model. The dependent variables are categorical and
non-continuous. Mainly the relationship between the dependent variable and
independent is expressed by a 'log' expression. Ex. Predicting the odds of a
child experiencing high rapport with a virtual agent using the percentage of
dialect in a entire dialogue.
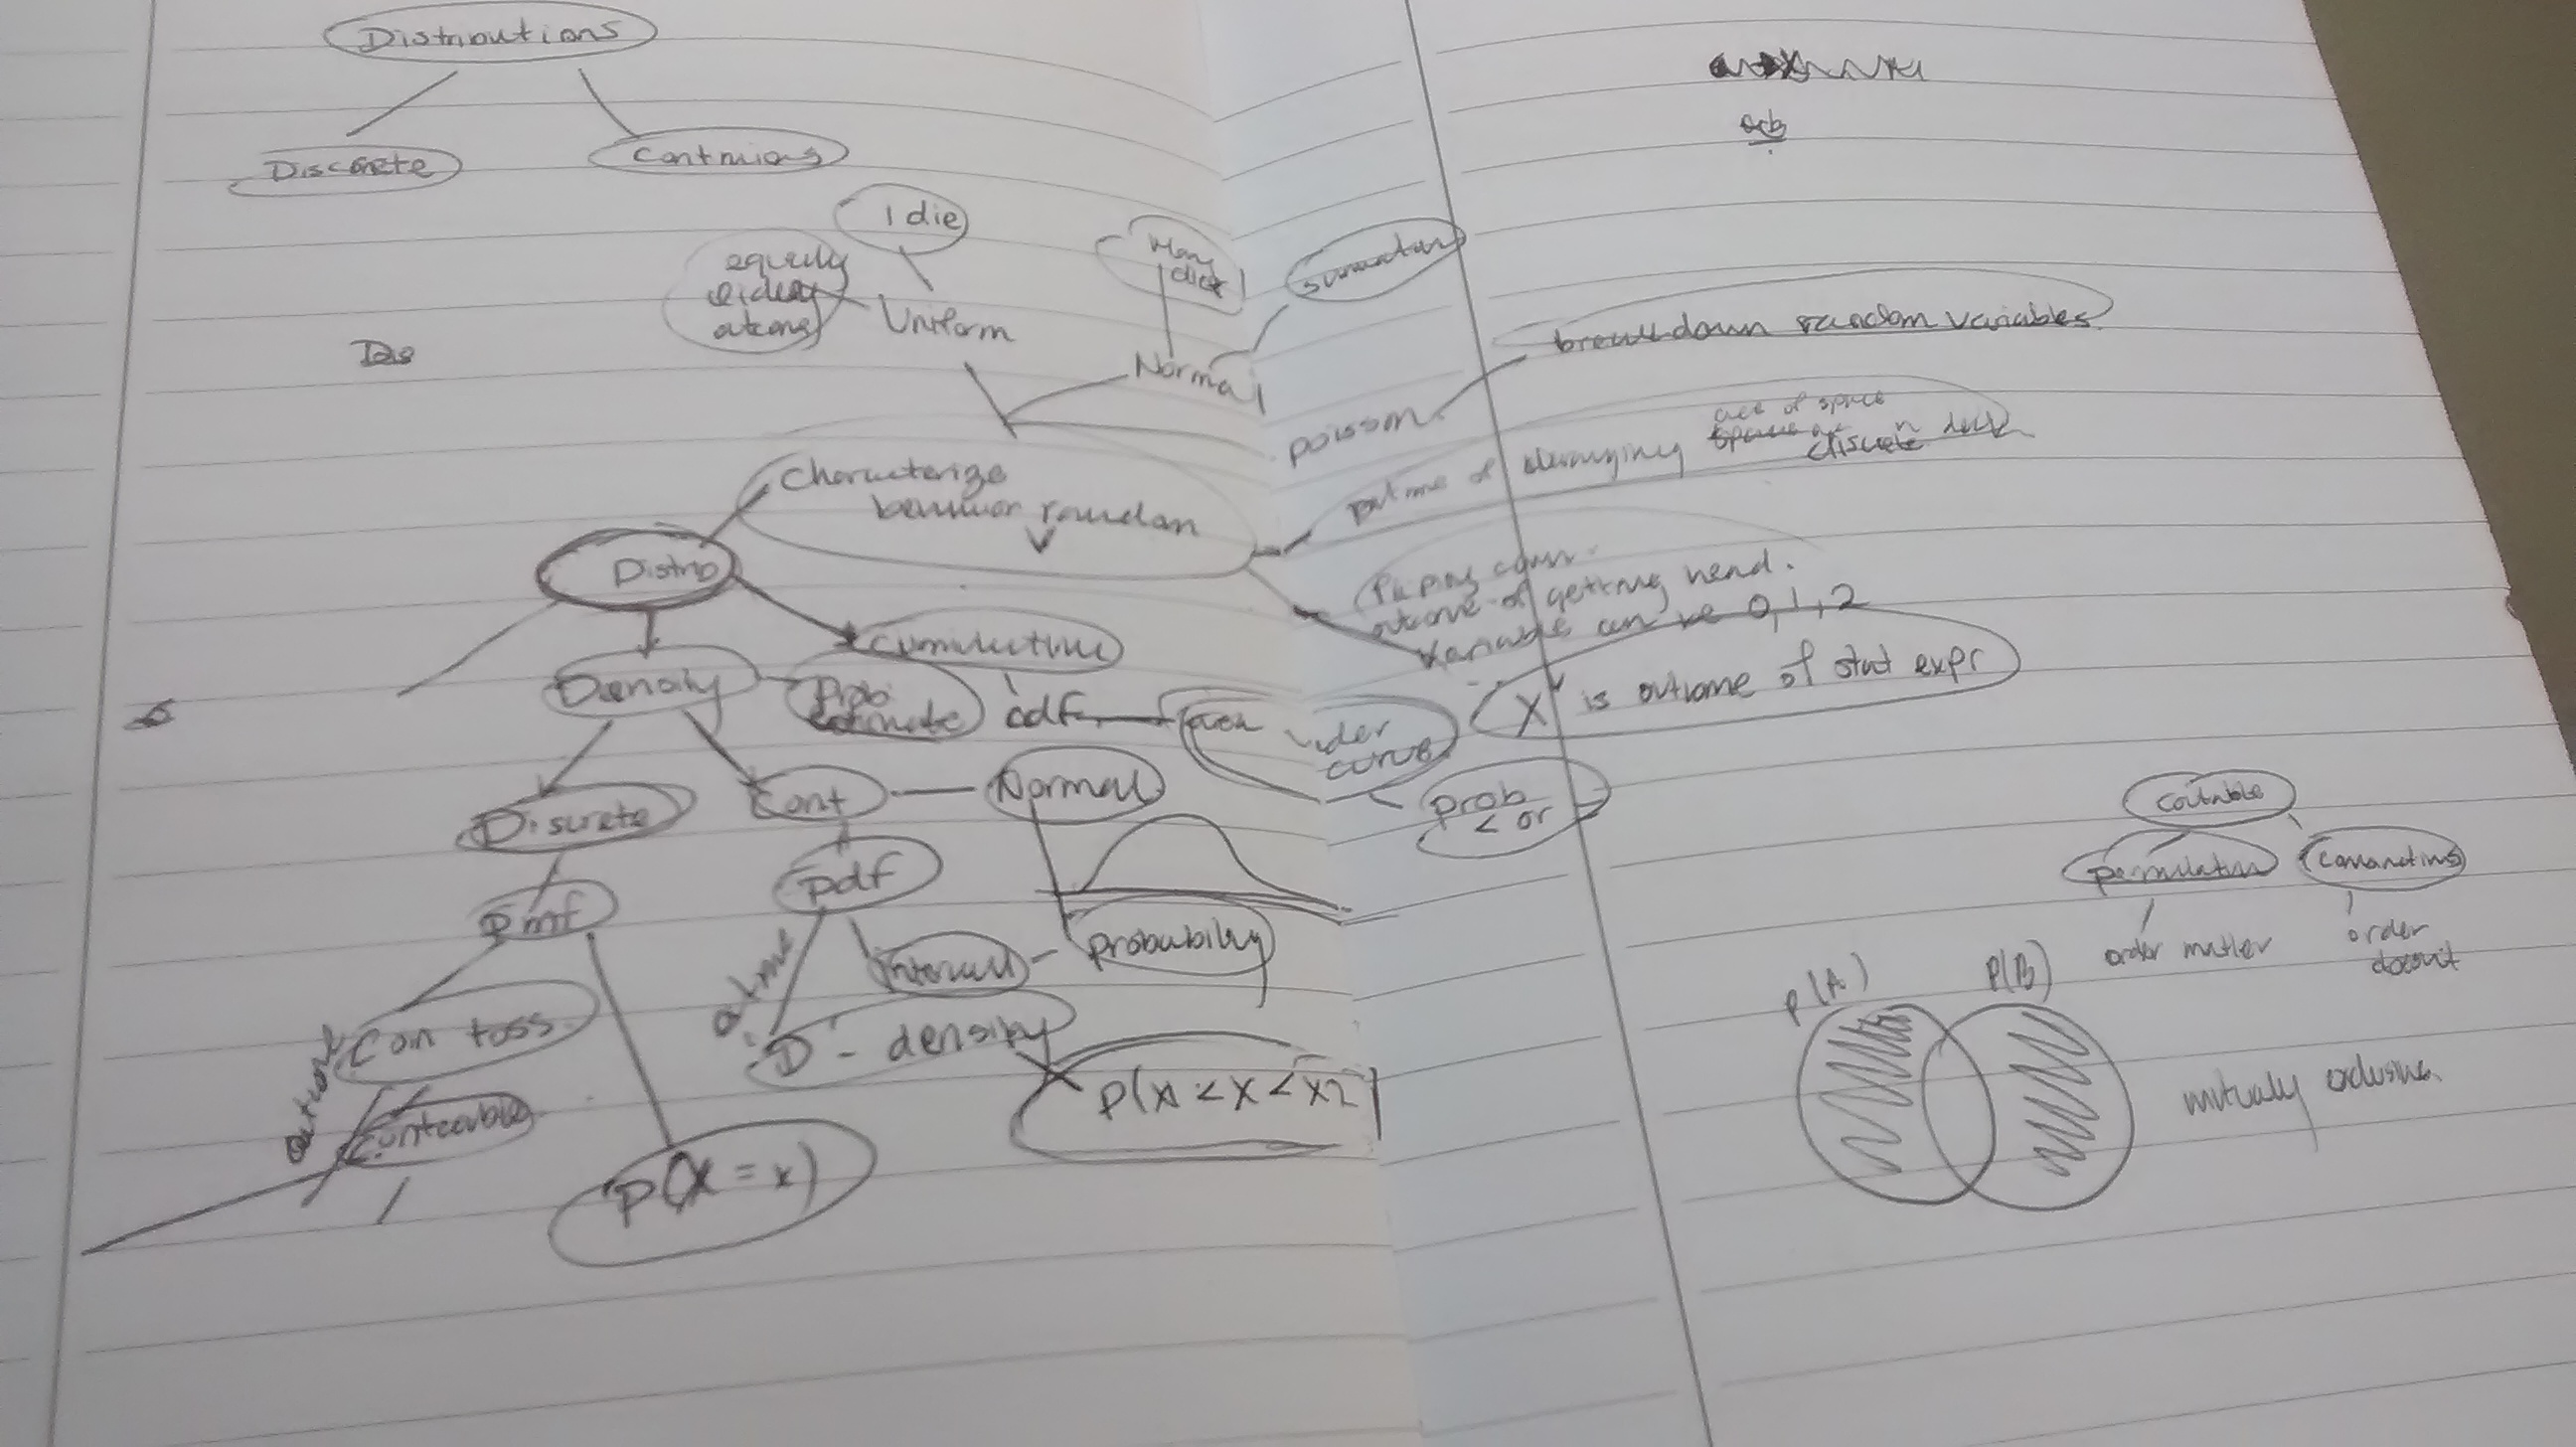
Dr. Seltman's Class we covered an
overview of the following terms:
-
Sampling Distribution: Distribution is
generated by running repeated experiments we can also get the distribution by
generated data using bootstrapping methods which stimulates the n numbers of
experiments in a software will using a random seed. In the end, the sample data
is plotted on a curve that is called the distribution. The distribution is used
to make predictions about the population. Ex. We can predict how much dialect a
child speaks in comparison to his peers of his school.
-
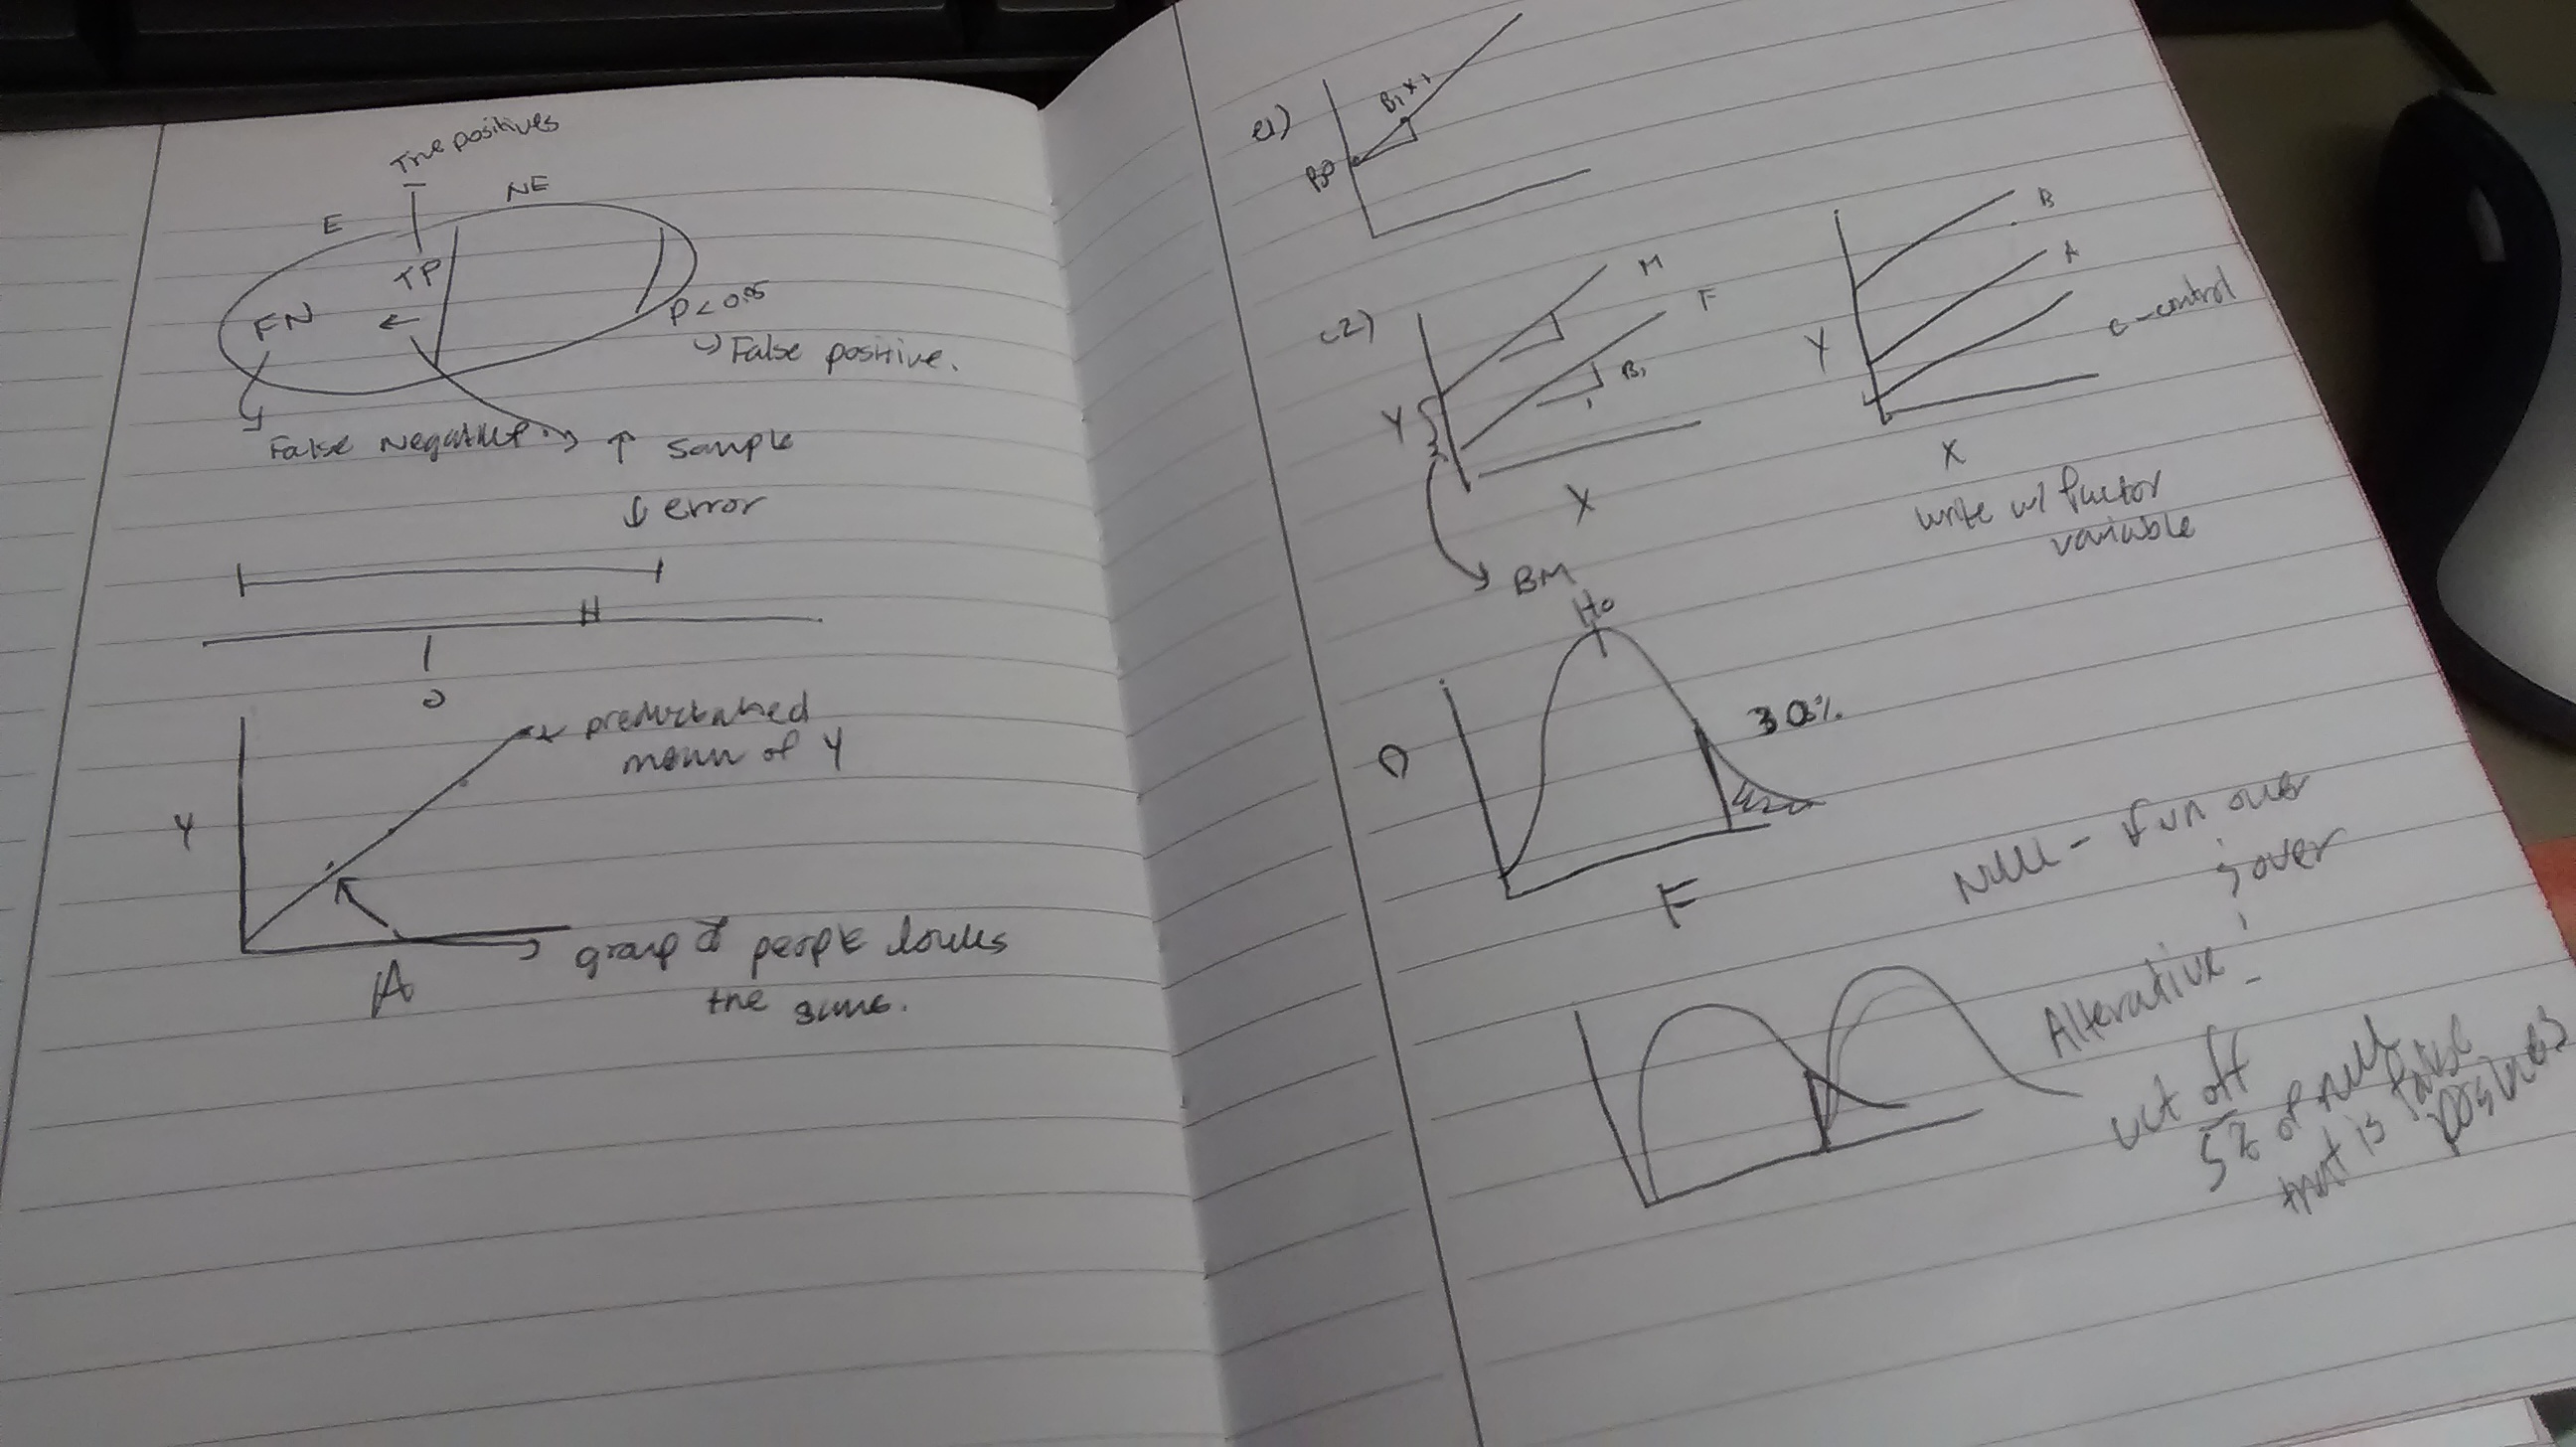
Null Sampling Distribution: A type of distribution that illustrates the probability
- result if the hypothesis is true. For instance, the average amount of dialect
- spoken in a classroom from a school located in low income region is only 10%.
- The null hypothesis is that Ho = .10. If we want to prove that the average is
- higher then we will expect the distribution to be more positive right tail of
- the null distribution to reject the null hypothesis of 10%.
-
Three methods of mediation analysis: Baron and Kenny, Product Estimator, and
- Casual mediated effect:
Pro:
-Baron and Kenny - could be tested with multiple mediators.
-Product Estimator - is faster and robust, is a built in boot-strap model that relaxes
assumptions
-Casual mediated effect- formulated and explicit concise analysis
way that could be expressed as a equation.
Cons:
- is most likely to be higher error because we have to perform multiple
regressions and look at multiple p-values.
- existing libraries and
bootstrapping methods is limited to only two mediator variables.
- may be complex and convoluted in figuring out the variables to plug in. - R script
example using the three methods
- Multiple mediators analysis - Mediated,
Unmediated analysis, and Missing Data
Goal of mediation analysis is to calculate the fraction of effect on result
using various methods such as Confidence intervals,
p-values using bootstrap methods or aggregating the causal effect.
Unmediated Analysis- is more difficult than mediated
because that is if all the assumptions are corrected for and there's no
cofounders. This method is more ideal for controlled environments.
In mediated analysis post treatment variables could not be correlated with the
mediators. Meaning that there should be no relationships between a mediator
variable measured for otherwise we need to include that mediated value as a
dependent variable in the model to remove bias. Ex. High report -> High Dialect
density -> High science performance. If science performance varies with amount of
dialect than we must measure that in the model.
-
Missing at Random is a scenario where have missing data that contributes to
-only the independent variables maybe a some of elements of a column of
-measurements records for how many science word utterance in a 30 minute
-conversation student A have with a virtual agent. In this case we will two
-options to settle the discrepancies
1) Ignore the entire column from the result,
-which will result in lower power and precision of the analysis method
2)-Performing imputations missing data by adding error and randomness to the data
-set, which is better than option (1) but could be a little biased.
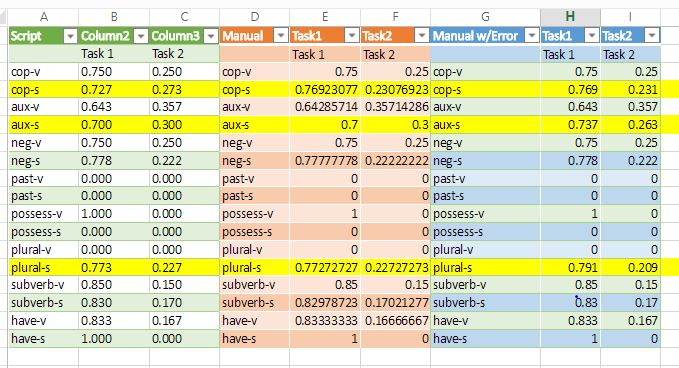
Previously, I have manually calculated the
Dialect Density Measure, percentage
of dialect a child speaks in two scenarios of talk with a virtual agent. This
task is tedious and error prone because I will have to make about 10+ arithmetic
and data manipulation operations to calculate for each of the 30 participants in
the study. I had multiple instances where I made the grad student worry about
the outputs because at first it showed that there is significance in within
subjects and between subject test where we have the children speak only student
English with the virtual agent in the two scenarios where it plays the teacher
role and peer role; And have a independent variable in which the kids talks to the
virtual agent code-switches between Venular and Standard English in both
scenarios. After, further evaluations the between subjects in which the children
speaking with code-switching agent is the only thing significant. Therefore,
writing a
script that does the computation will ensure that the correct results
are generated.
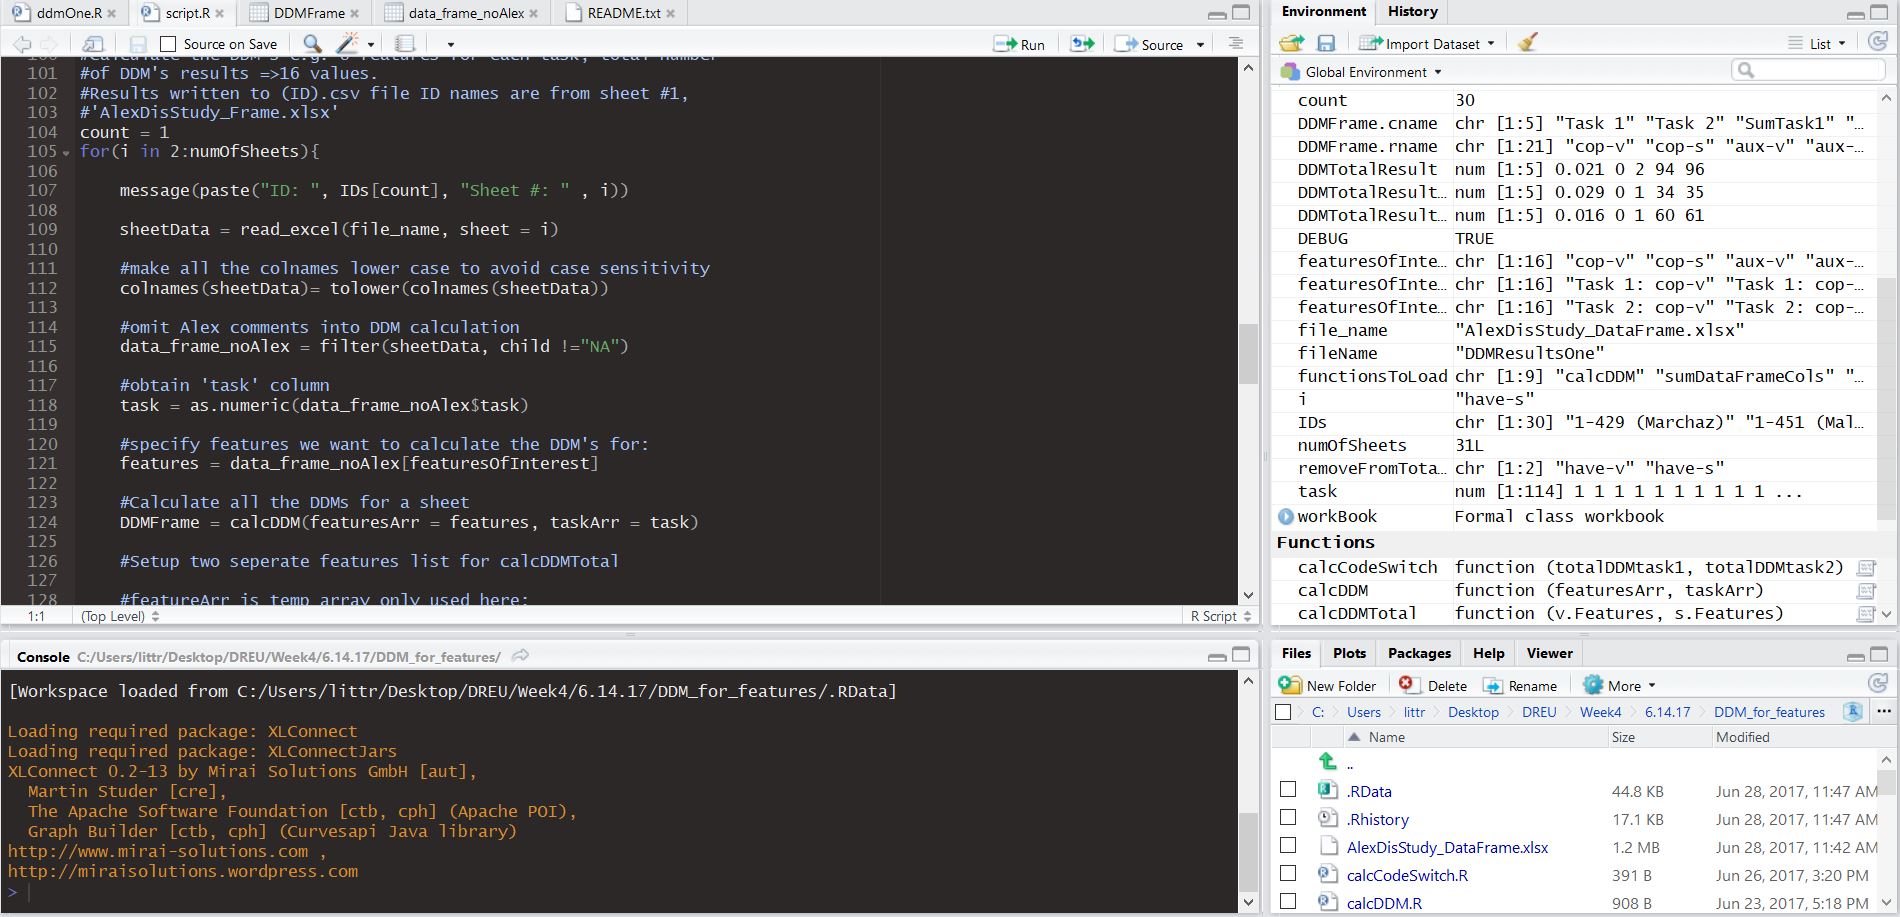
I proposed to generate the data results into multiple files by creating a script
in R. I was successful in creating it to account for all the listed features (are
grammatical features such as pronouns, verbs, etc. that child utilizes) and
have the script generate 30 files with the DDM results inside. The script just
iterates through a excel workbook and sums up columns that corresponds with a
child's response that is tallied under each of the measure features. It will
then generate what is called a
data frame (which is a type of data structure in
R) that is just like a table or matrix. For each iteration, a new data frame is
created and written to a .csv file.
Week 5: Fixing Script & Delivering Elevator Speeches
This week, I continued working on the R script that auto calculates Dialect
Density Measures from our study results. I had a couple of challenges in the
process of writing it but eventually got so that a summary result of DDM data
for each of the participants. I also was able to with grad student mentor,
Samantha, about grad school. She also helped us how to deliver a effective
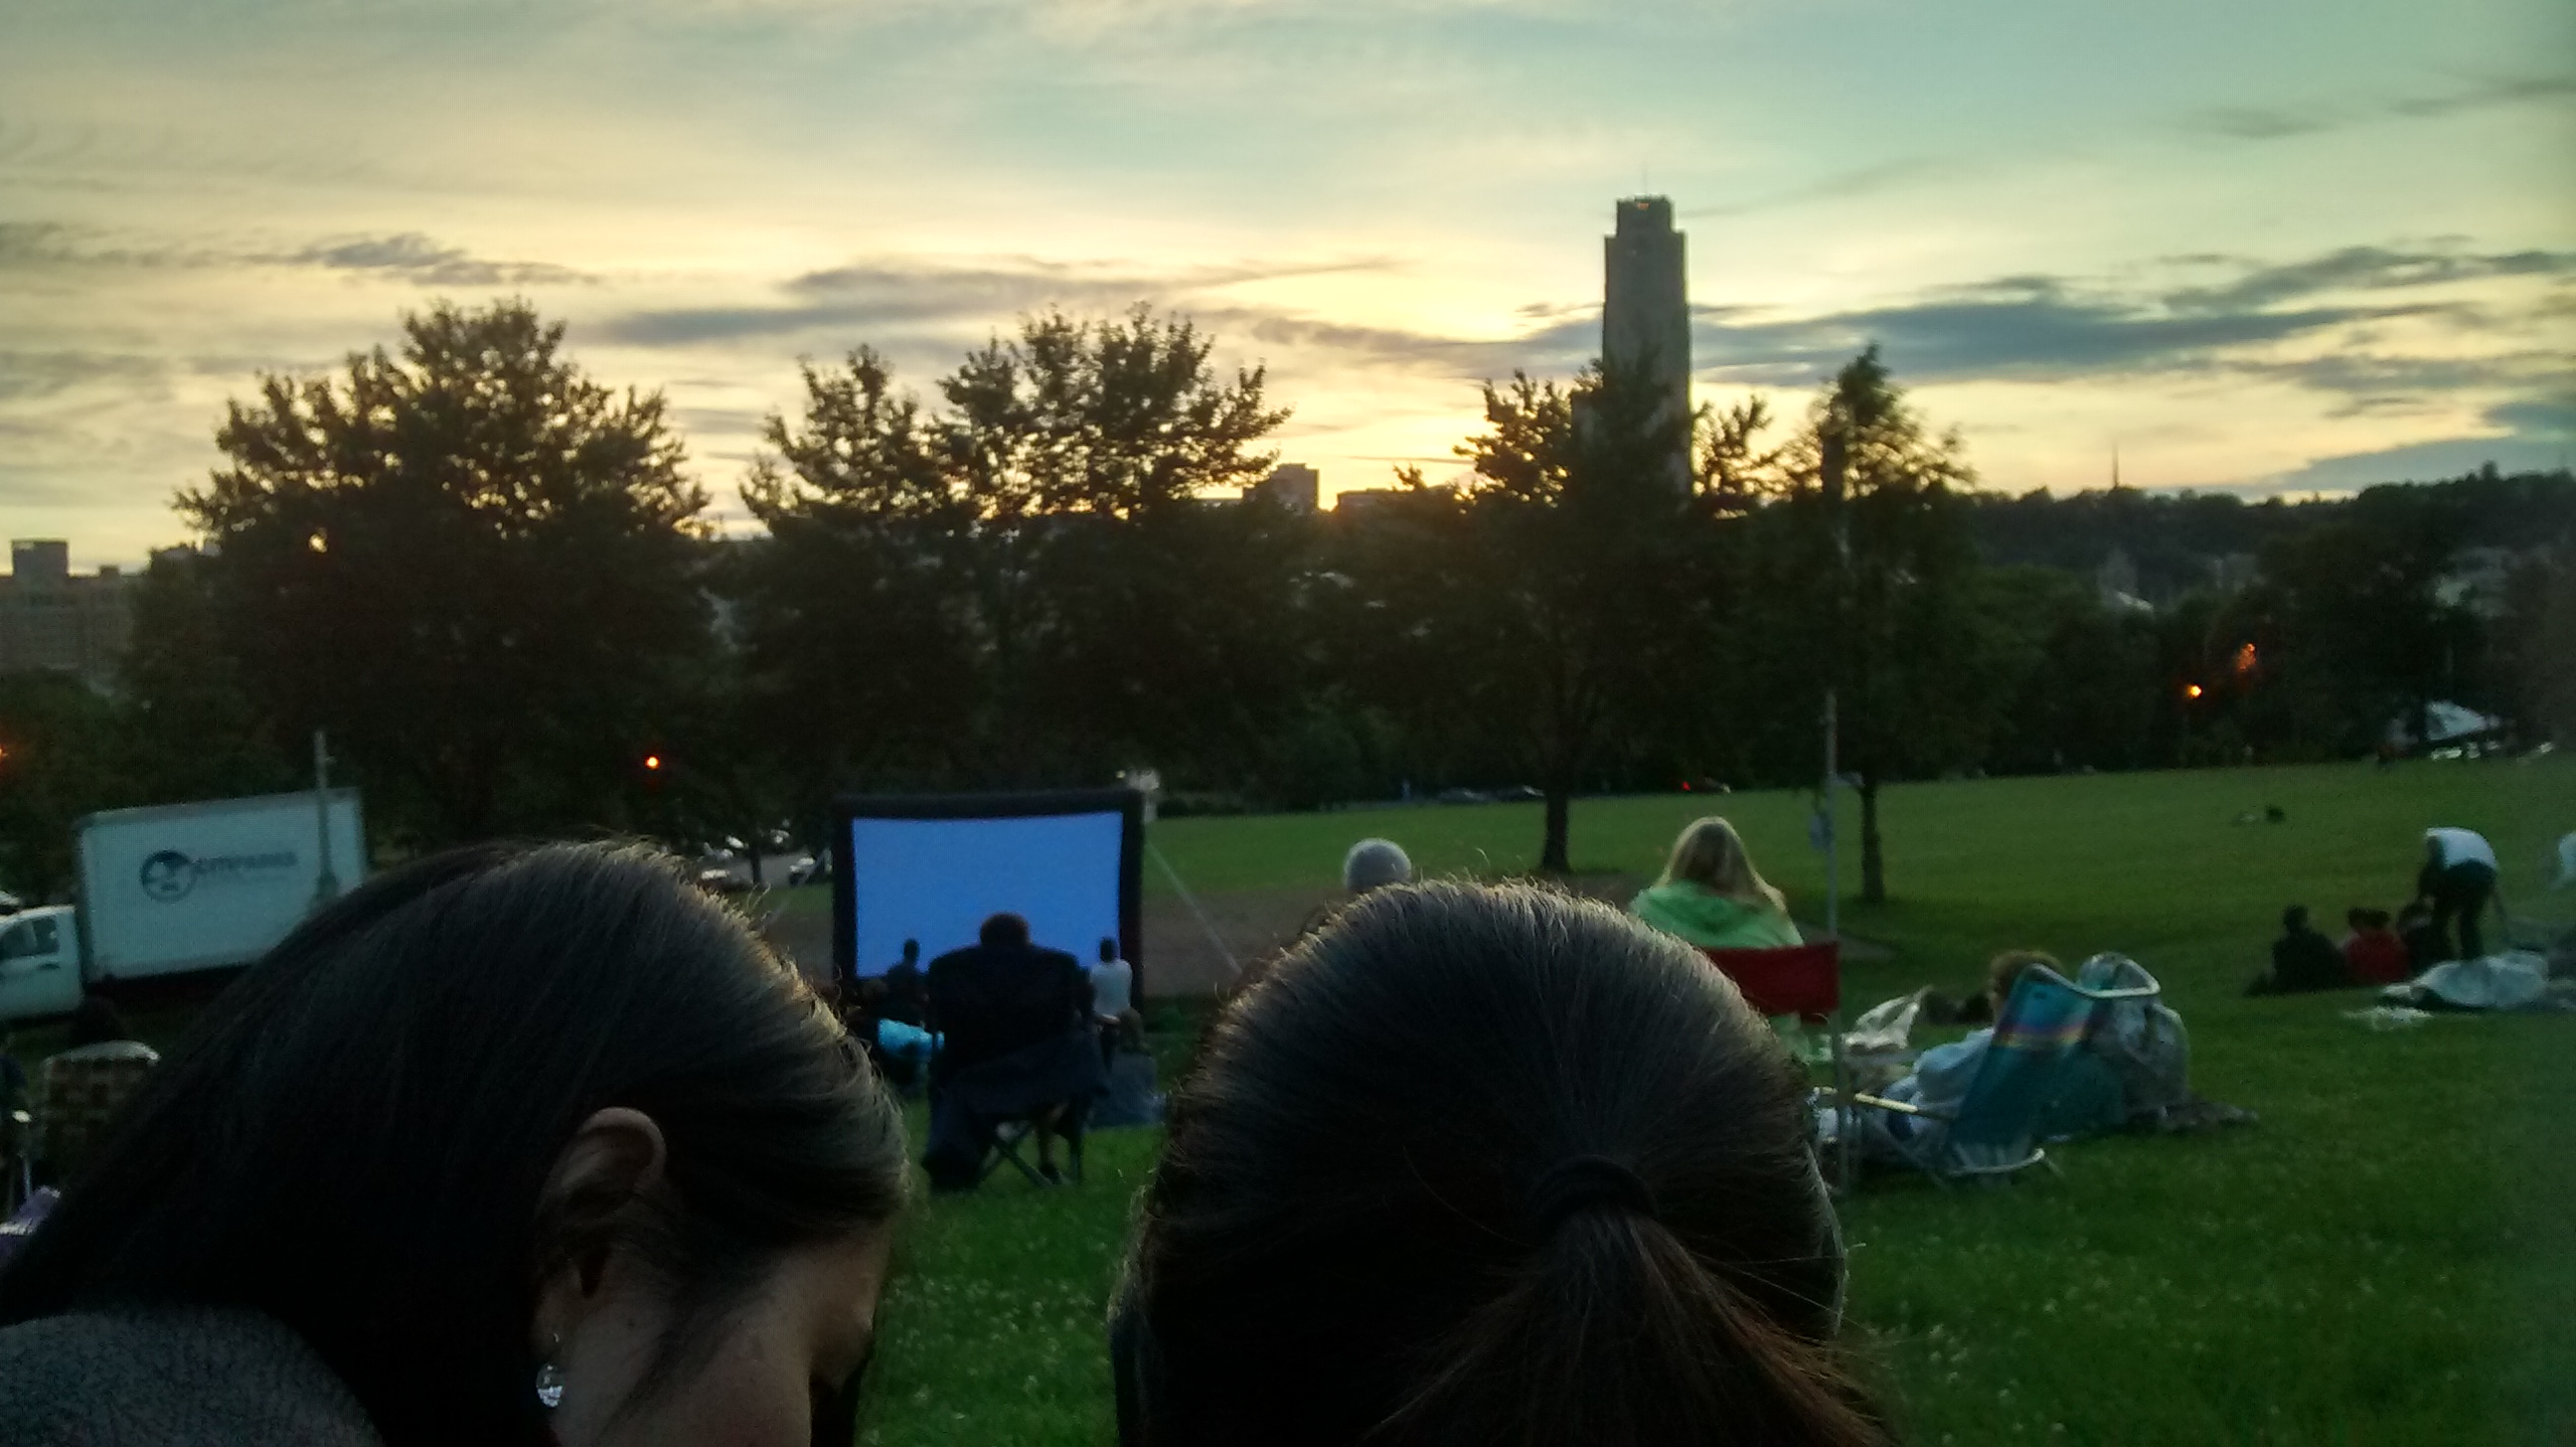
"Elevator" Speech. The "Articulittles", as they call the interns had the group
meeting outside at a park.
Here are some of things I accomplished this week:
1) Brainstormed elevator pitch, about project, lab, and interest
2) Validated script for correct output with manual calculates
3) Identified formatting issues that prevents the
scripts getting the right output
4) Participated in Thursday Articulittles' meeting
5) Drafted & Uploaded DREU Midterm report
At the last Intern's group meeting on Thursday, Samantha discussed about how to
brainstorm
good elevator pitches. I find it helpful because in the past I have
always been terrible in explaining to others what my research about. The reason
being I feel enormous pressure in delivering a good elevator speech otherwise I
am not doing the research any justice. I want to justify why my research have
any contribution to the research world. Therefore, she simplified what we need
to consider when delivering a pitch in 3 steps.
1)
Audience- we need to tailor our speech the specific audience we are
addressing by selecting key words that they empathized with
2)
Goal - we need to identify our goal, what we want to
accomplished, for my case I want to address the need to study how language and
culture influences a children's success in impoverished school settings.
3) Predict their
position now on the issue and how to win them over on being in our
side.
A elevator pitch should be short and start with a
hook. Coming up with a
captivating hook was fun we went around the table and have everyone quickly say
their hook. I am amazed on the creative angles that every approach them hook.
For instance, we have the 'SARA' project which is currently a virtual agent that
recommends movies to people. The hook was about utilizing the trend that
technology is becoming more advance, applications that are more interactive with
users are becoming popular because people desire the need for companionship with
their devices. My hook was about that schools are becoming more diversified and
should accommodate for students that come from different culture backgrounds.
Writing the script was kind of difficult because I had to go through a series of
steps to read in the data. The original data is imported from
ELAN, software
that allows us to annotate complex audio sources, we utilize this software
addition to Audacity to extract annotation dialogues from our experiments. The
ELAN file .eaf, need to be exported to a
Comma Delimited files, .csv files.
After figuring that out. I learned that I needed to come with convention that
allows me to systematically read in the data from R by importing all the 30
files into a workbook in order so that when I compute the DDMs I can easily
identify each file by the sheet ID # and name from the original file. I learned
that some of files when exported generate a extra line that shifts the data down
a row which is a unique case that I had to consider in my program that
identified that needs to be fix. In addition, I learned my
manual calculations
that I had to verify and compute 3 times are not reliable for sometimes the
'sum' function will not work on columns of data that are not formatted a certain
way. Therefore, both of the results obtained from the script and manual
calculations are inconsistent therefore. Most of the week I was identifying why
the results are inconsistent.
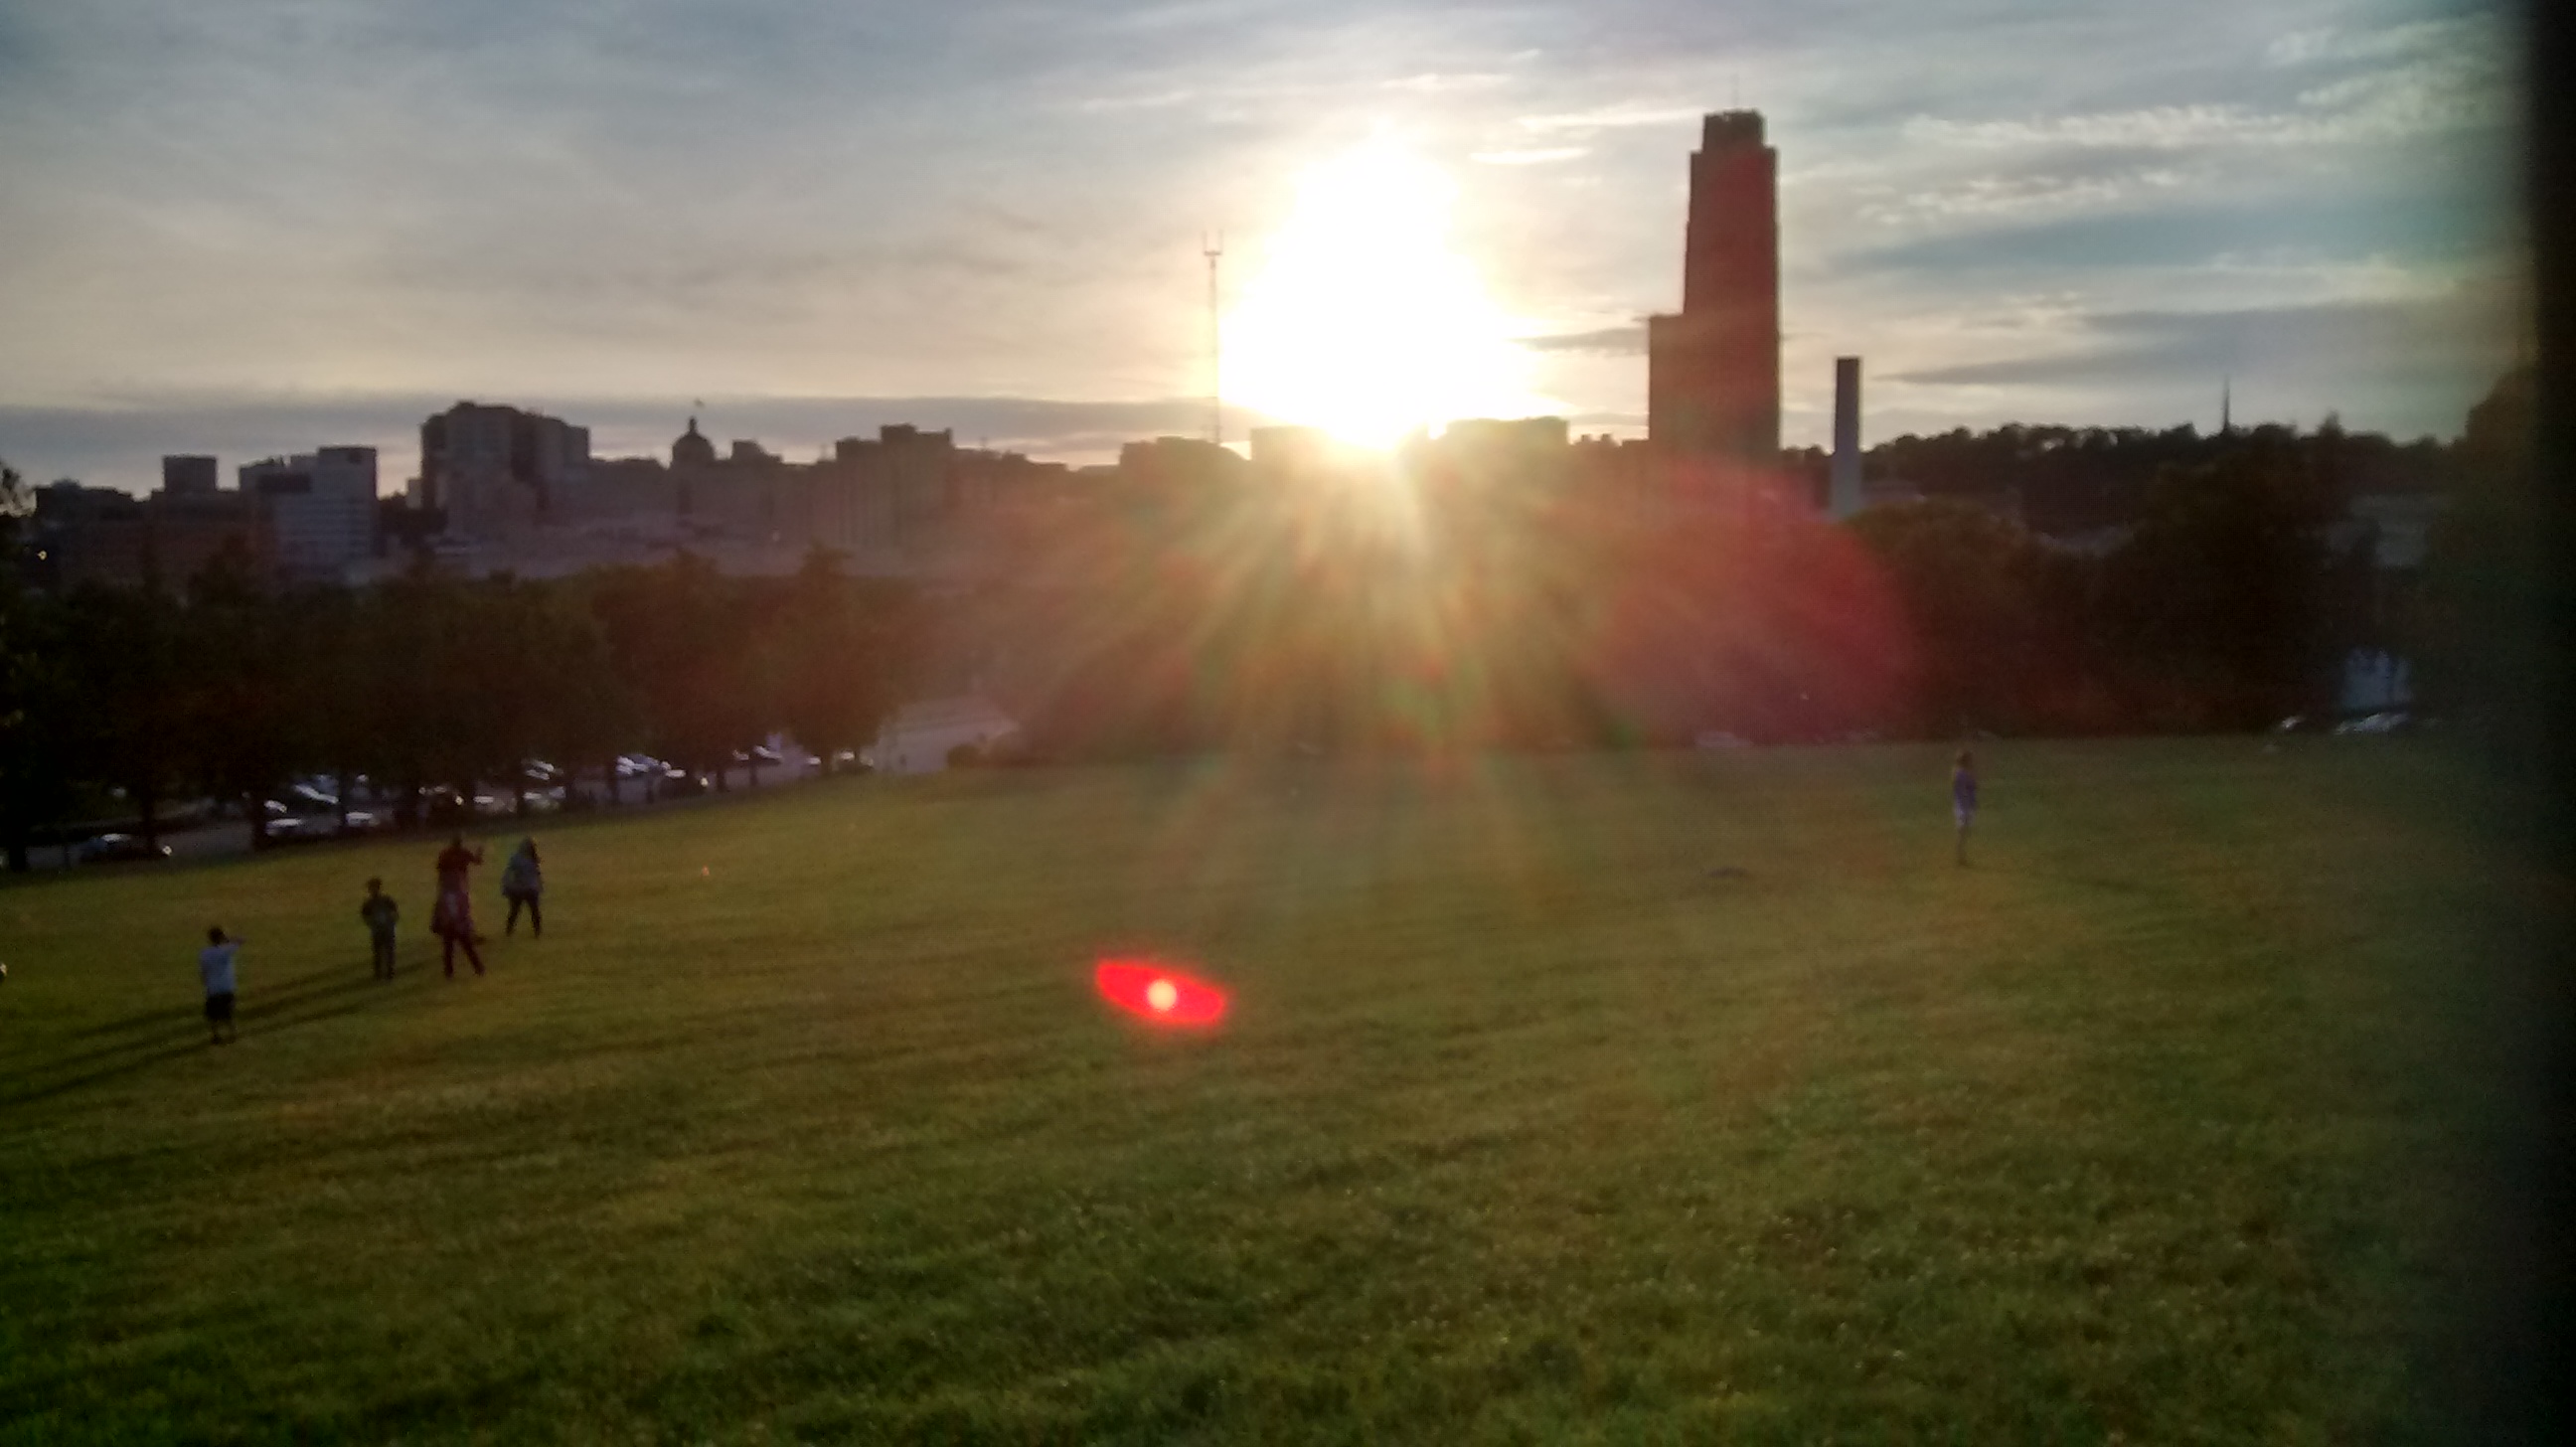
This week's intern meeting was fun. We had our meeting at park nearby campus,
which we reference as the park with the dinosaur. We quickly delivered our
weekly updates and then played a
game of taboo. The thing that is different is
that each of the rounds are played differently. The rules are that everyone
first come up with three words/phrases into a pile and we are supposed to play
the first round as we normally do with taboo and with each round it gets more
interesting round 2 we are only allowed to say one word and round 3 is charades
with guessing the word. I am happy that Samantha had arranged the intern fun day
because I was able to get to all the interns more on a personal level.
Lastly, I coordinated with Samantha about the
DREU Midterm report she helped me
look over the report before submitting and draft the mentor report to be sent to
Dr. Cassell for review and approval. My only comment about the forum where we
submit the reports is that I feel limited because each question has a max
character count of
1000 characters I did not consider that when drafting the
report so I had to cut out some of my report to have it fit in the response
boxes :(
Week 6: Identifying inconsistencies in Data & My DREU buddies
This week I accomplished the following things:
1) Worked on formatting DDM output
2) Identify data files that needs to be re-exported to match script
3) Worked on updating DREU Website for weeks 4,5, and 6
4) Participated in Intern meeting
5) Discussed with Samantha about next week group meeting among the Alex people
Last week, I identified the reason for the inconsistencies in the
DDM
calculations result from script and manual log. Early in the week, I went
through all the data sheets and identified the line and file that have a extra
line so that our annotators, Caitrin and Ryan, to correct. I then had to
emailed Samantha, Caitrin, and Ryan who are involved with the data about the
issue so that everyone was on the same page and specified the specified the next
steps we need to pursue to finish gathering the DDM results some of which
include:
1)
Generalize script to take in other form of data
2) Make changes to the output format of the DDM table from suggestions receive from Ryan and
Caitrin
3) Identified the features I need to account in DDM calculations for the
new data
4)
Re-run the script with the re-exported data
5) Upload the new ddm
data frame.
I spent the remaining of the week summarizing my accomplishments and reviewing
what I had down in the last 2-3 weeks to
update this journal. I had
compiled my accomplished by referring to my daily hours tracking sheet that
Lauren Smith, the ArticuLab Lab Manager put together. There I record the number
of hours I worked it day and the time when I arrived and depart; there I also
can note my accomplished and challenges I had throughout the day. Having the
hour log allows me to easily recall what I had done daily and enable me to
quickly write my journal entries here. I had to also compile pictures I wanted
to upload to the website for that week too. I find that the most fun part of
writing the journal entries.
This week
Intern Meeting, we started off by all walking to the Gates Center for
Computer Science building because our conference was occupied for the hour. The
building was a wonderful place to have our meeting. We also had someone there took a
couple of group photos so that we can participate in the DREU photo contest this
year. We are very eager to win because we all pose for the photos. We already
captured 3 sets of occasions that will be entered in the contest. I am excited
about taking group photos because I like to look back on the photos for
memories sake. Hopefully, I can get access to them soon so that I could submit
to the contest our group is to take as many pictures as we can so that each one
of us could submit to the contest, since there are so many of us DREUs students
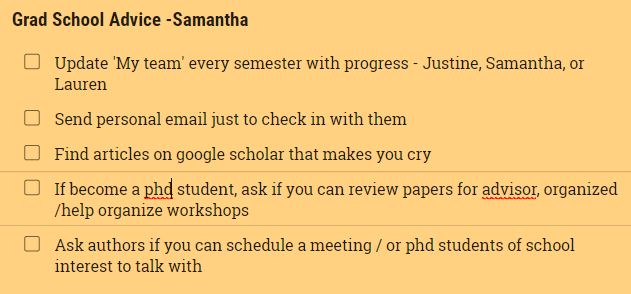
here. Also we also talked about
Graduate School and the process of applying, how
to choose a mentor, the importance of the GRE, and applying for funding.
Here is a mini introduction to the other DREU students in the lab:
We have
Vivian Tsai,
a uprising Junior in Computer Science from John's Hopkins
University. She is working on the
Sara project and identify ways to improve
the app such as optimizations that speeds up the process of Sara interpreting
and obtaining user inputs. Sara famous figure of our lab although I was told
her name is no longer Sara, but I will still call her talk until she is
officially assigned another name. Sara is everywhere in the case that she is
suppose to be the embodiment of a personal assistant that gives you
recommendations about movies, and engage with others to build meaningful
relationships to assist them for instance the current live version of Sara
assist people at the World Economic Forum in Tianjin, China. She utilizes machine
learning mechanism to responds to user requests. Thursday, yesterday, was the
first time I witnessed a live demo of Sara interacting with a person in the lab
and took a selfie with Sarah and Max! She has a vivacious personality and loves
to collect books. She also labeled herself as a "bad cook" but I believe that
with practice, she will get better. Also, she is big Harry Potter fan too.
We have
Sarah Matthews , a uprising Senior in
Computer Science from Hunter College. She is working on the
SCIPR, Sensing
Curiosity in Play and Responding, which is a board game that is design to have
children engage in collaborative learning among themselves and with a virtual
agent. The goal is to identify what motivates for children curiosity in
learning. Sarah is responsible for working with the AI component of the game
such as coming up with a dictionary of rules for the players to use in the game
in addition to the game strategy approaches that should be consider in the
process. Sarah also wants to pursue graduate school in a phd program for
Sustainability. Sarah is a bright individual who I consider to be very
charismatic and outspoken. We both love cooking and food buddies.
Lastly,
Max Collins , a graduate from University of
Illinois at Urbana Champaign. He majored in Psychology and Informatics. Max
works on the
SCIPR project along with Sarah. He is responsible for doing the
annotations of the data recorded from the videos recorded of the children
interactions. He also helped with identifying what social queues or
behaviors encourage children curiosity to learn. Despite being a psych and
informatics major, Max, has some incredible research experiences in his past
internships and have a good amount knowledge in programming and app
design. He about to start his phd program at University of Irvine soon in the
fall in their Informatics Graduate program. Max is a forward-thinking individual
who eventually want to become an entrepreneur in building a startup company.
Overall, I am very happy to part part of a lab full of smart and talented
individuals. It is very inspiring to get to know everyone here. I think I will be
sad when I leave.
Sometime next week, Samantha plans to have a group with the
Alex interns and
discuss wrap up ideas on deciding proposed hypotheses to start organizing for
conference paper submissions. Her ideal goal is split us into group of 2 to work
on hypotheses to test. I am excited to learn about how to purpose a
hypotheses that involves testing the number of utterances that a child makes in
the pretest monologue test, we child was recorded in describing a picture
without interruptions for about 20-30minutes and measuring the density of
utterances and seeing with the two different scenarios of talking to Alex how
their engagement (level of shyness changes or when the child becomes comfortable
enough to talk to the virtual agent). I also want to work with applying a
machine learning technique that Samantha spoke about that one of our past lab
interns under another project called
RAPT, Rapport-Aligning Peer Tutor: Virtual
peers building rapport to support students in learning, designed that detects
and does pattern recognition. Once we have access to that code I want to learn
how to utilize and transform it so that we could brainstorm some experiments
to design.
Week 7: Wrapping up data frame & Preparing for final report
This week was odd because of July 4th. It started on a Monday where I woke up
cranky because I realized that mondy is not. It is okay though
because I had some work that I needed to finish.
Here are some of things I accomplished this week:
1) Finished identifying all annotated files that need to be re-exported
2) Finished importing the re-exported files into a single worksheet on Box.
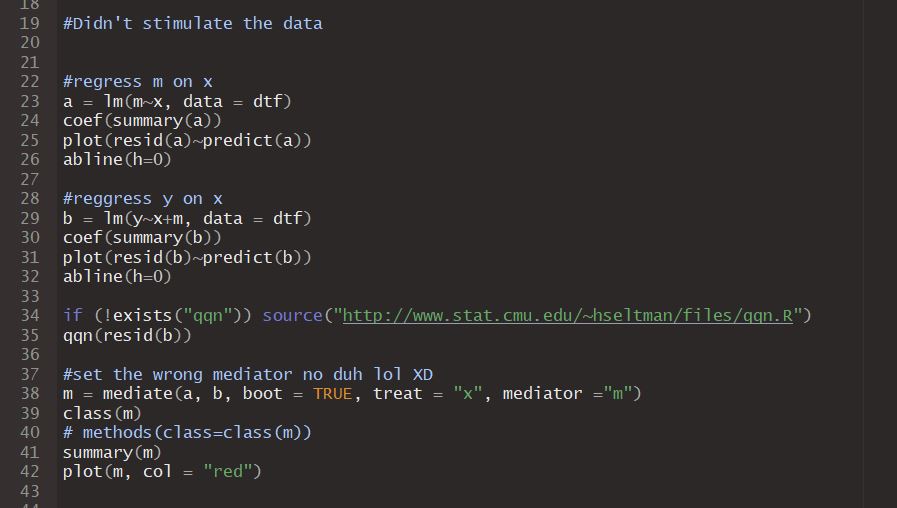
3) Completed first assigned homework for the Mediation Statistics Class
4) Participated in the interns group meeting about CVs
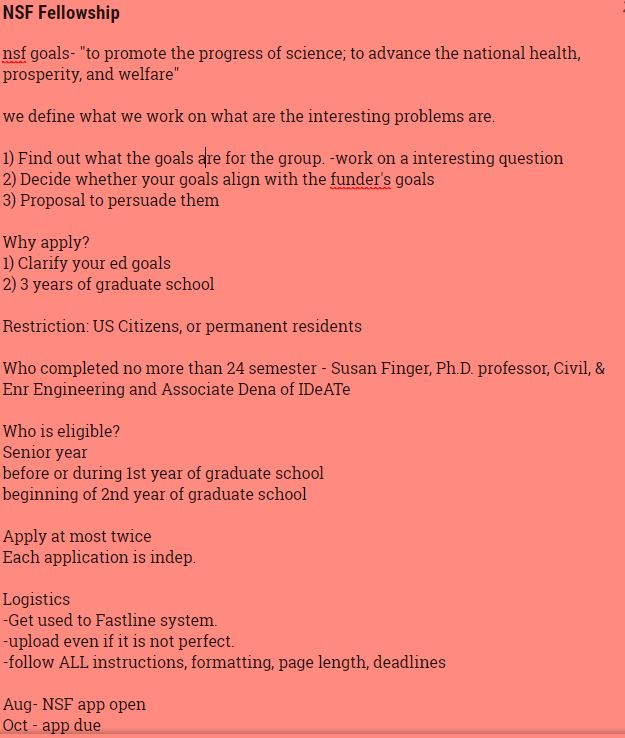
5) Attended Workshop on NSF Fellowship
6) Started on preparing
for Final Research work (i.e. Annotated Biography and Literature Reading)
After double checking the results from the script file. I learned that there 5
more files that I missed last week. I identified the special case. The problem
about how the annotated data exported into excel have row data that is shifted
down a row. I learned that working with data from various different formats and
source could be tedious and are prone to error. It requires a lot of time
preparing the data and checking. I decided to import the data into a different
program in this case, R. There are limitations on the extent on how clean data
are imported into Excel. Therefore, best way to work with data Excel is to
limit the number of platforms that the data is exported or re-imported into as
much as possible. Some of the hypotheses that I came up with about working with
data are: the risk of file corruption when data is not handled carefully like
being exported too many times, error about confusion about how data is
interpreted in the process could lead to wrong results, expect to find
formatting issues that need to be address and leverage whether it is it worth
trusting a script or doing certain calculations by hand. I learned not to rely
too much on the automatic functions such as 'sum' that we take for granted
because sometimes something as small as formatting could lead to error in
result. These factors are things that I learned to work with this week. I also
came to realization for the future in my research career in human interaction
is that despite the fun of measuring the effects that a technological device on
human subjects most of the challenge is worrying about how the data is
collected, how to process the data, and how to interpret the data. Interpreting
the data requires the knowledge beyond the background field that I expected
which is Computer Science. I learned the important that inter-disciplinary labs
can contribute to research. For our lab, it is important that we have people who
understand statistics, computer science, linguistics, and physiology.
Completing the first homework for the R class was fun and exciting because for
the longest time in the class I finally amends with the fact that I do
understand the materials presented in the class. Although it is just simply
using R pre-loaded existing libraries. I rely appreciate the fact that I could
apply that statistics knowledge I learned from the class to manipulate the data
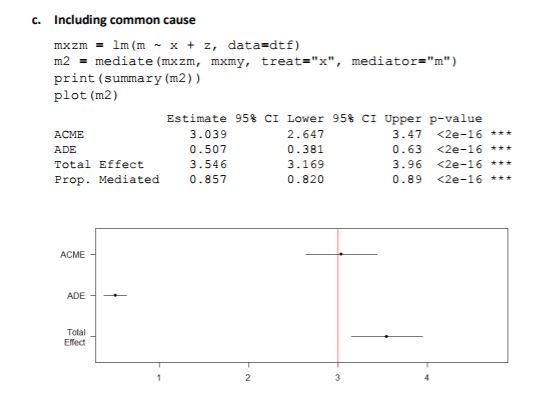
and result. I learned how a confounding variable could influence the mediated
effect of some X on some Y. Therefore, accounting for that would lead to more
accurate results. Also, with mediation there is no way of finding out 100% that
measuring a common cause is correct. In addition to reviewing the homework for
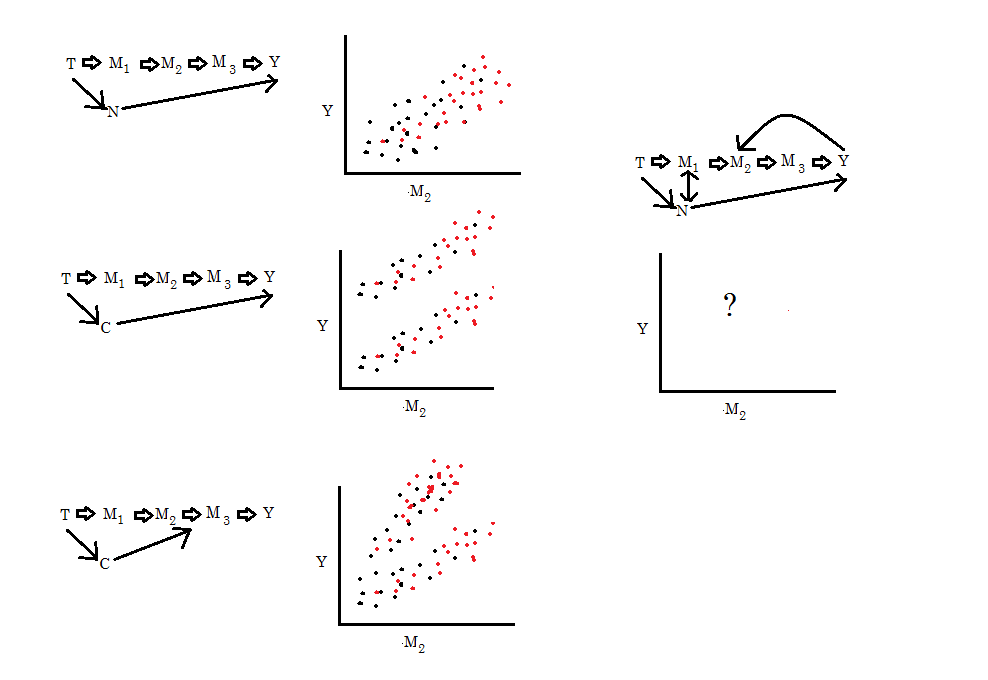
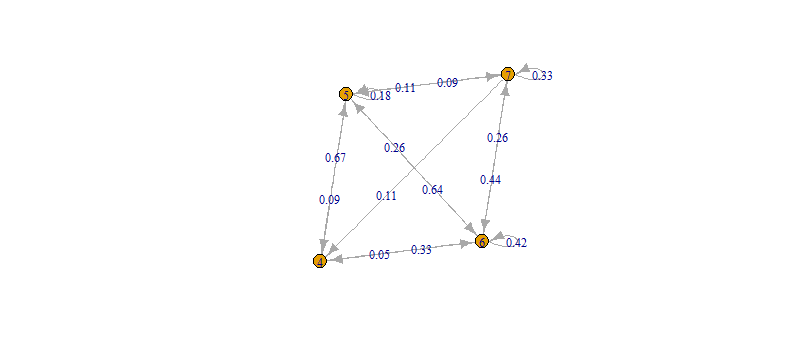
the week. I learned about how
casual relations could be represented in a
Directed Acyclic Graph (DAG) which is a requires understanding that the graph
has no cycles. We represent X and Y on the group and the casual variables. The
graph will only work if we make sure that all variables are represented as a
DAG. Causes variables are called exogenous variables are represented on graph
with no arrows into them. In R we could cut all the inputs to X aby using do(X).
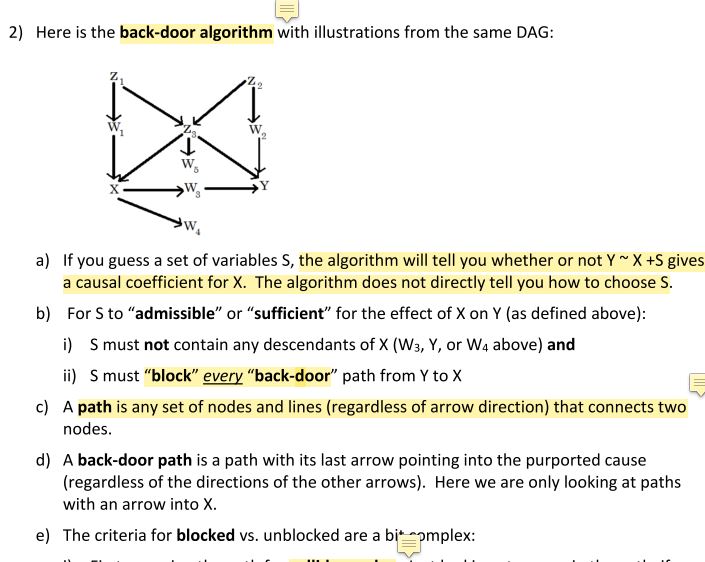
The
backdoor algorithm tell you whether or not we get the conditioning on a
variable could results on having the correct casual effect for coefficient of X.
This algorithm is best demonstrated using diagrams instead of verbal
instructions.
During the
CV workshop, all the interns paired with a partner to critique each other CV/Resume. I helped one of the interns with critiquing her Resume and
taught her the difference between a CV and Resume. I also identified ways to
better format her CV to make the resume look cleaner in communicating her work
experience. I offered to send my CV that is written in laTex to her as
reference.
I learned a lot from the
NSF fellowship. I inspired me to reason why I want to go to grad school and how I could prepare in applying for it soon. I started off
by considering what I wanted to write about in my proposal. I want to write
about a project that involves an application of using artificial intelligence
technology to understand ones and interpret one’s emotions particularly with the
medical potential of using as a diagnosis or threptic device. I research about
current projects that exists and asked Samantha to reference me some potential
authors to search for as well. I found this in part of my search around
preparing for my final report.
Next week, we are wrapping up on preparing the data frame full of all the data
we have collected over the summer to data analysis and testing next week. I
learned that I had to back-track a little because I calculated the DDMs for the
individual features wrong. I learned that I should always remind myself what my
end goal was and what I was calculating to see if the output make sense before
proceeding too far. Also, I should also decide names for variables that best
makes sense for me so that I won't get confuse.
Week 8: Prepariing Data for Calcuating Utopy & Reading Papers
There were a lot of meetings that happened this week.
The wonderful thing about was the free food
in the meeting room. Also, have two fun activities planned for the week.
1) Interns Luncheon meeting with
Dr. Cassell
2) Baseball Game at the PNC park (Pirates vs. Cardinals)
This week I mostly focused on understanding a new technical approach
of measuring rapport that is used in the lab called
"utopy".
The approach was proposed in (Sinha, Tanmay and Cassell, Justine , 2015).
The approach was used to illustrate that rapport changes with time.
The paper purposes the mechanism for finding the link between convergence
on learning and rapport. Following that research (Sinha, 2017) provides
an in-depth analysis of measuring
rapport in longitudinal peer tutoring.
With the mechanism they found a that rapport changes overtime.
Micheal Madaio ( 2017), used Utopy to illustrate how indirectness influences
rapport among dyad tutoring partners.
Taking a step back rapport in these context means the likelihood
that there's a mutual understanding and agreement
between two or more subjects. In our lab have multiple studies
around these measuring indicators. Rapport is usually had annotated
by our linguistics majors.
After learning about purpose of Utopy I worked on modifying my
data to fit the setup necessary for
calculating utopy.
Besides, my focus on utopy. I also worked on the following things
throughout the week:
1) I worked on updating the DREU website for week 7
2) Attended R stats class
3) Read papers about Utopy
4) Attended intern meeting on CVs
5) Install environment for running python
6) Attended Workshop about "Writing the Personal Statement"
8) Played the "Outbreak" game with SCRIPR project people
This week we had a short class for the
R class.
The topic was on
Power Mediation. I had to leave early
for this class to attend the luncheon with Dr. Cassell.
We reviewed some familiar topics. I learned that power is
important in determining if a experiment is worth analyzing for.
Power relates closely with the null effect and p-values.
Power is measured by a percentage of which you see p <- 0.05
that we see no significance in the data. I learned that power
testing should be exclusively used to test before the experiment
is measured. Usually with power calculation be aim for 80% power
of risk in failure for a given meaningful effect size.
We can calculate power using ANOVA (non-central F distribution)
and can be calculated by stimulation. Normally, power is computed with
more than one scenarios are evaluated.
Here are some of the notes about Utopy I learned.
The motivation behind the Utopy is analyzing rapport
is that most of the research focuses on cross-sectional
rather than longitudinal.
In the lab we perform experiments that studies correlation
between rapport and learning. We conducted user studies
measuring rapport by having raters
to rate 30 seconds slices of videos.
Utopy illustrates the
probability of predicting higher rapport
over a duration of time for our study it is in thin-slice of 30 seconds
separated by task 'peer' and 'teacher' and by session of interaction
by participant. The data produces 4 files for each thin-slice by task and session.
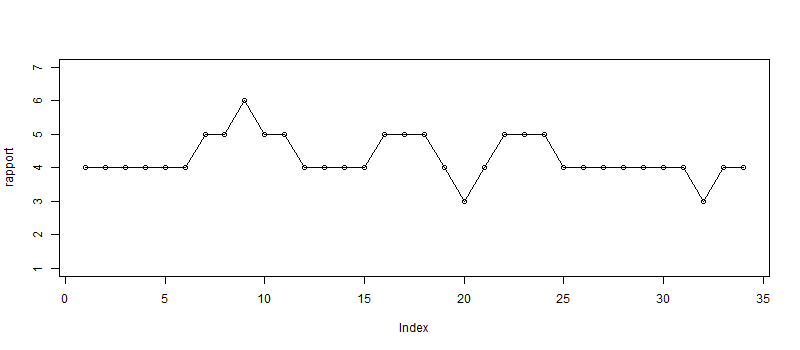
1) Graphical interpretation of Utopy in a
directed graph
2) List of averages or rapport
3) Line plot of illustrate the trend of by slice number and rapport.
The results that we expect to illustrate with Utopy are understanding
if rapport is likely higher by task in a between subject test.
We can also visualize the rapport score trend comparison by task.
During the intern's meeting. We discussed ways to improve and tailor
our experiences descriptions to match the job/career we pursue.
Some of the useful tips I received was selection or
word choice.
Sometimes using a mission statement from the job sometimes henders job
prospects if the jobs mission doesn't align.
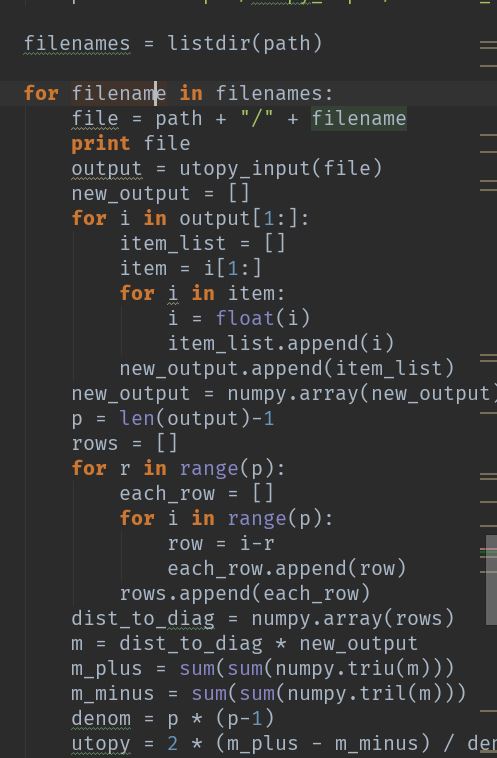
I installed the
Pycharm IDE to run the script. The process was easy.
The only difficulty I had was understanding what the script was doing because
the individual that wrote the script did not much code documentation yet.
Other thing that I worked on was formatting our data to match the input
the Utopy expects to take in.
During the workshop this week. I learned the about the process of writing
a
personal statement and the importance of 'fit' with the target program.
I learned about the
STAR story for describing our research work.
The acronym stands for Situation, Task, Action, and Result.
Style of deliverance is important in captivating the readers.
Lastly, I participated in the planning the
'Outbreak' game. The things I learned
from the experiment is the that discussion is important in building rapport and
curiosity.
Week9 : Wrapping up & Data Analysis
This week I worked on wrapping up my project. I started off by wanting to write
up the final report using the tradition methods of doing autobiography,
literature review, abstract, and then outline my paper. However, I realized that
I am running out of time to also prepare for my project presentation to the lab.
I am most worried about this because I have always been bad at presenting in
front of other people. The thing that makes me most nervous about was
disappointing others and not having anything impressive to present to them.
Unlike the last two interns, I felt like I didn't do any substantial work worth
talking. But then again I should not compare myself with others. Therefore, I
continue to push my way through preparing for the presentation. At first I was
going to present a poster but then learned from Samantha that it is not
appropriate way to present that in front of a group of people.
I was able to schedule a brief meeting with Samantha to get clarification about
what I was going to present. It was really helpful because I was overwhelmed
about the idea of presenting everything about my project. I thought I had
go back to the beginning and do more
literature reading to derive my hypotheses
to start writing.
After meeting with her I learned that I could present about the Utopy
calculations I did last week. Samantha thought it would be interesting to
compare Utopy with average rapport because normally in the past they would only work with average rapport. Samantha was able to guide me on ideas of what to
test utoy and average rapport with. Because we have multiple features/variables
to experiment with. In the process of doing data analysis I learned that I was
pretty weak at interpreting graphs which is embarrassing. However, I continued to
work at it. After that Samantha provided my helpful tips and an outline of
questions I need to address in my presentation. I also learned that I had to go
back and really think about what Utopy is and why it is important. Understanding
that took a while of reading and conversating with Samantha. I am grateful that
she was patient with me through the process.
Coming up with hypotheses was hard because I realized that throughout the process
I didn’t fully understand the project well enough to understand the methods of
which the data are measured and how they interact to come up with predictions
and hypotheses involving them. After a long while of thinking I was able to
come up with the
hypotheses that rapport impacts children's ability to reason.
Therefore predict that higher rapport results in higher reasoning and that utopy
is more predictive than average rapport because it considers the change of
rapport over time.
Week10 : Drafting Final Presentation
This week I worked on wrapping up my project. I started off by wanting to write
up the final report using the tradition methods of doing autobiography,
literature review, abstract, and then outline my paper. However, I realized that
I am running out of time to also prepare for my project presentation to the lab.
I am most worried about this because I have always been bad at presenting in
front of other people. The thing that makes me most nervous about was
disappointing others and not having anything impressive to present to them.
Unlike the last two interns, I felt like I didn't do any substantial work worth
talking. But then again I should not compare myself with others. Therefore, I
continue to push my way through preparing for the presentation. At first I was
going to present a poster but then learned from Samantha that it is not
appropriate way to present that in front of a group of people.
I was able to schedule a brief meeting with Samantha to get clarification about
what I was going to present. It was really helpful because I was overwhelmed
about the idea of presenting everything about my project. I thought I had
go back to the beginning and do more literature reading to derive my hypotheses
to start writing.
After meeting with her I learned that I could present about the Utopy
calculations I did last week. Samantha thought it would be interesting to
compare Utopy with average rapport because normally in the past they would only
work with average rapport. Samantha was able to guide me on ideas of what to
test utoy and average rapport with. Because we have multiple features/variables
to experiment with. In the process of doing data analysis I learned that I was
pretty weak at interpreting graphs which is embarrassing. However, I continued to
work at it. After that Samantha provided my helpful tips and an outline of
questions I need to address in my presentation. I also learned that I had to go
back and really think about what Utopy is and why it is important. Understanding
that took a while of reading and conversating with Samantha. I am grateful that
she was patient with me through the process.
Coming up with hypotheses was hard because I realized that throughout the process
I didn’t fully understand the project well enough to understand the methods of
which the data are measured and how they interact to come up with predictions
and hypotheses involving them. After a long while of thinking I was able to
come up with the hypotheses that rapport impacts children's ability to reason.
Therefore predict that higher rapport results in higher reasoning and that utopy
is more predictive than average rapport because it considers the change of
rapport over time.
Week11 : Rehersing Final Presentation
This week I continued to work on my final presentation. I was hoping to finish
everything by Wednesday and send the slides to Samantha as well as rehearse with
her on Thursday.
I was able to finish drafting the slides and had Samantha look at my progress.
At that point I was overwhelmed with pressure of not including enough
background information to present to work but forgot to think about the
essential part of the project which is to focus on what my contribution and
the motivation around it. My biggest mistake was to not come up with my own
motivations and just rely on the ones that Samantha drafted for me. Also, I
still was not comfortable about what the data in my slides meant. Therefore, I
did a very terrible job rehersing it over with Samantha. At this point I felt
terrible and wanted to crawl under a rock because of the embarrassment of having
someone explain to me how to read a graph. Now looking back at what I leaned I
should have paid more attention to everything I learned. I should of spend more
time getting to know what the variables I am wanting to analyze and
contextualize them in a way so that I could easily understand instead of
focusing on the overall completeness of my presentation.
Therefore, I decided to request a to postpone my presentation to the next week
which would mean that my termination date of the DREU program will be on Aug 11
instead of Aug 6. I spent the Friday interpreting my data. It took a long while
because I realized I went through the experience not applying to much of my
critical thinking skills to understand the importance of the data I have but
instead focus on writing scripts to provide the data or format data. I regret
not taking advantage if the time I had to get a deeper understanding of what
rapport meant, why we care to learn about it, and it does it influence learning
in classrooms. Mid-way through this experience I forgot about my purpose of
doing research and the whole idea of applying the 6 scientific methods that I
was taught to do so since the beginning of the experience. I realized I got
caught up with waiting to long to have someone till me what to do instead of
independently thinking about what I could of done.
In my data I learned if we look at average rapport vs. percentage of reasoning
kids want to reason and measure that across two conditions of 1-on-1 interactions
with a virtual agent (suppose to stimulate a learning environment). I learned
that if we plot that relationship we see that kids who are placed in an
environment that expects them to speak only standard English they would have
lower average rapport then kids that allows them to code-switch between two
dialects (African American Vernacular English and Standard English). The amount
of reasoning across the two conditions doesn't look significantly different.
However if we look at the relationship between average rapport and reasoning in
the code-switching condition we see that they not only have higher average
rapport than kids that are exposed to the other condition but that kids with
very high rapport wants to reason less and if we plot reasoning against utopy we
see the same negative relation. Therefore shows that kids when placed in an
environment that allows them to code-switch they would want to reason less.
However if we compared the reasoning percentages across conditions we see kids
will want to reason about the same amount if not more for the code-switching if
we zoom in to the left graphs it is apparent that range in total reasoning
percentage is higher for code-switching condition than non code-switching.
Therefore, this overall it is useful to look at both average rapport and utopy
which contrast my prediction. Average rapport allowed use to see that standard
condition rapport is lower than code-switching and that there's not
relationship between average rapport vs. percentage of total reasoning. Also
that average rapport shows use that code-switching average rapport is higher
than none-coding switching. Utopy shows us increase in rapport is not always
good for environments that builds really high rapport in a short amount of time.
As shown on the right graphs that shows that children reason less when rapport
likely continuous to increase in time. But standard condition rapport is still
increasing but unlike code-switching rapport and reasoning increases together.
I learned that interpreting data is most difficult for me when I didn't spend
time thinking about the meaning of the variables and do critical thinking on why
it is important. This week I had to spend a lot of time looking into
motivations about why rapport matters and how might it influence kids learning
in classrooms.
Week12 : Presenting Final Presentation
This week I worked on preparing myself for presenting my final presentation to
the lab. Originally, I was supposed to present last Friday but had to postpone
it till the next week. I am glad that I continued to work an extra week because
my presentation went better than I expected. I learned a lot in this last week
regarding my topic about rapport and children's learning. Samantha helped me a
lot in preparing the data and helping me interpret it. I learned one most
important lesson this summer is that should always take consider every
opportunity as a challenge for improvement. Before I thought it is of me best
interest by showing that I am productive and show that I am doing a lot of work
each week. However, that is not the purpose of the experience. I thought I knew
what research was about when I first enter the ArticuLab but it is not. Despite,
having prior research experience. Every experience is different. I learned to
face some of my weaknesses in my technical skills that is required for
conducting research. Therefore, this week I spent a lot of time critically
analyzing what I learned this summer and learning how to interpret it so that I
can easily explain it to other people.
I learned from Samantha that when becoming a researcher, it is important that
you know how to communicate your findings to others. Also, a lot of dedication
is required into preparing it as well as time constraints for my case it was 10
minutes long and 5 minutes for Q&As.
I had to rehearse and revise my presentation a lot in a span of a week because I
focus too much on telling a background of way rapport was important instead of
focusing on establishing what part, I looked at specifically which is a way to
measure rapport and its relationship with the way children learn. The unique
angle of my research of comparing utopy (the probability of increase rapport)
vs. average rapport. The findings were pretty interesting that average rapport
for determining whether it is productive to look at utopy or not. Because utopy
doesn't consider the average base rapport high average doesn't always mean high
utopy. I learned that students with already high rapport will have a negative
correlation with the amount they will reason because they might have already
maxed out their rapport level. In contrast, students with okay amount of rapport
will benefit of building more rapport. Therefore, they will benefit in gaining
more rapport and reasoning increase. The implication of the study is that we
should first build education interventions that focuses on building high utopy
at first up until we reach a certain amount of average rapport and then work on
maintaining the rapport instead of continuing building it.
When presenting my research, I found it helpful that I make sure I limit how
much I say and make sure it is communicated in a concise and straightforward
way. I could do that by summarizing each slide into a sentence. Overall, I am
grateful this whole experience. It has really put everything I accomplished thus
far into perspective that there's always room for me to improve and that I
should always welcome more challenges instead of trying to hide form it because
that is the only way I learned how to grow. I am happy that the presentation
went better than I have ever thought.