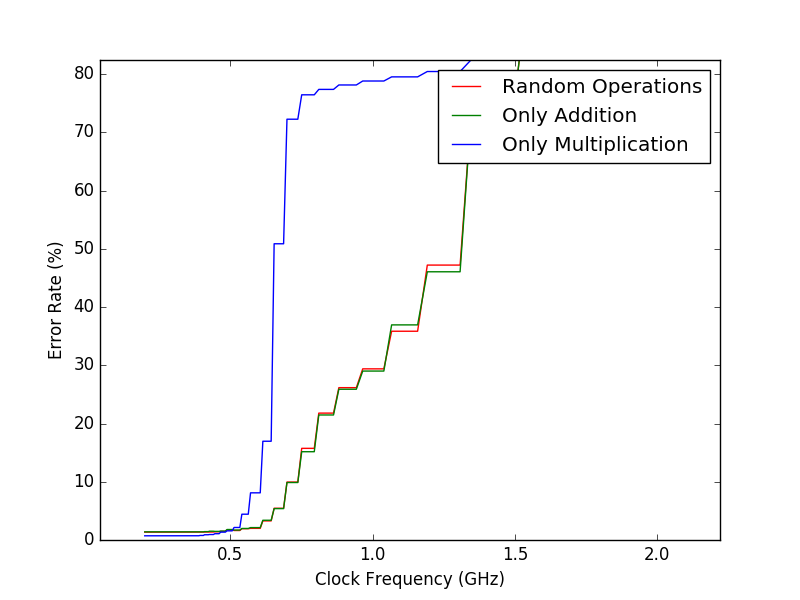
Over the weekend, I had the server run the experiment with three different test vectors: only addition, only multiplication, and a mixture of both. When I got back to the lab, they had all completed. Using the pyplot library, I could plot the results on a graph pretty easily. Below are the preliminary results:
A graduate student is planning on continuing the research I am doing, so I spent a majority of this week explaining the work I had already accomplished and how all of the scripts work. In addition, I set up a workflow automated the data collection aspect of the 64 bit FPU experiment. I also wanted to analyze which bits of the output generated the most error, so I created a better tool to analyze the data. This too will take a while to finish, but it is all automated. Once these processes finish, I will have everything I need to start writing the report.