About Research
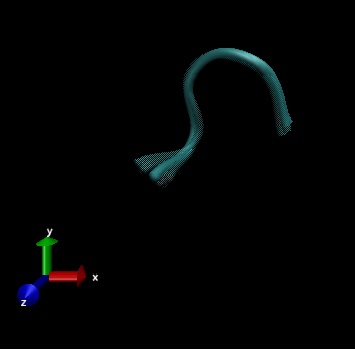
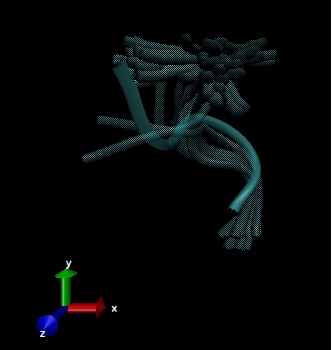
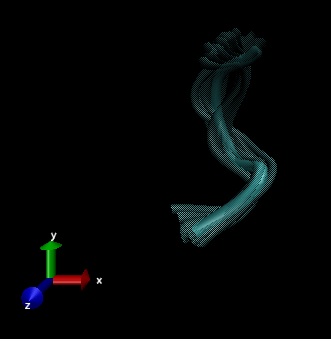
This research is learning about the flexible structure of the opioid, Met-enkaphalin based on three experimental entries from Protein Database Bank (PDB) called 2LWC, 1PLW and 1PLX.


The goal of this project is to map a structure space using two ways, 1). molecular dynamics simulations and 2). an evolutionary algorithm using the Rosetta all-atom score12 energy function. Principal Component Analysis (PCA) is conducted on the resulted sets to get representations in fewer dimensions.
My role for this summer is to find statistics about structures, and also the connections between the structure transformation and the energy using voronoi graph. A Voronoi graph is a 3D graph with dividing edges. Each point is centered, and a number of faces are constructed around that point by a number of vertices and edges based on calculations with other points. A Voronoi cell is formed by a centered point and faces around it. Each Voronoi cell has topological neighbors, each of which are divided by a face. With all cells combined in the graph, a polyhedron Voronoi graph is formed. In this project, each met-enk structure forms a cell in the graph, and its topological neighbors are formed by similar models.
A voronoi graph is constructed for 6000 models got from minimization method with 2,000,000 steps. It is constructed using voro++ library, in which the Voronoi graphs can be built with different boundary conditions. In this research, we choose two different boundary conditions, rectangular boundary conditions in which the boundary cells are stretched out to meet the container walls, and irrecgular boundary conditions in which the boundary cells bound with its own walls. The voro++ library also output information about each cell in a Voronoi graph. Among different information we can get, we choose the number of faces and neighbors around each cell.
From these information, a starting point is selected and it chooses one of its neighbors randomly, which in turn chooses one of its neighbors at random. Then the graph is kept connecting until all 6000 points are visited. We run the program for 6000 times, with different starting points for each Voronoi graph with different boundary conditions. The paths and the frequency visited at each point are used for analysis.
As another approach, Metropolis Monte Carlo (MMC) graph is used to find biased random walks. In MMC approach, instead of randomization, the neighbor is chosen based on the calculated probability using the energy differences and comparison with a random number. If the random number is smaller or equal to the probability, then the neighbor is chosen, and the process is repeated for that neighbor. If the random number is greater, another neighbor is chosen. The path ends when the point has tried every neighbor for 10 times and cannot choose any of the neighbors. This program is also run for 6000 times for each graph with rectangular boundary conditions and irregular boundary conditions. The resulted graph data are analyzed and compared to the random graphs.
 Flexible structures of Met-Enkephalin
