 Week 8: August 5 - 9
Over the weekend I worked on the Tapia2014 proposal and was very relieved to find out that the deadline was postponed! That meant we could take a break and further proof-read the paper over the next week before submitting it! It still felt good to have completed the paper and all that was left to do is make sure that we could submit the best work we did. It was perfect timing as I was just getting started on the statistical analyses and with the extra data I was gathering, we could further improve the paper with the extended analysis' result. However, the conference was calling for only 2 pages, and it truly was hard to cram our summer's work into such a short space!
Fortituously for me, I stumbled upon the excellent Perl package Text::NSP - Ngram Statistics Package and it was the perfect match for my work on ELAN. My head was spinning after reading so much papers on contingency tables and associated analyses! It was nice to see what the authors have done on the package and it definitely made my job translating it into Java much easier. Furthermore, the package was used heavily in academic circles, and the authors published several papers describing how the entire package worked. Their paper is:
- Title: The Design, Implementation, and Use of the Ngram Statistics Package
- Authors: Banerjee and Pedersen
- Source: Appears in the Proceedings of the Fourth International Conference on Intelligent Text Processing and Computational Linguistics, February 17-21, 2003, Mexico City
- Link to Paper: umn.edu
After reading their work and getting a much better understanding of what I had to do, I digged into ELAN's Java source to start the work on implementing the N-gram analysis. The hardest part actually was figuring out how the GUI would look, but after some time studying similar dialogs in the source I was able to figure out the sufficient black magic incantations to make the GUI behave properly, ha! I admit I do not like designing GUIs, as I am more of a commandline and backend person so it required a lot of poring through documentation just to get the JTable and associated classes to play nice with each other and generate the right output. It was relatively easy to figure out the actual N-gram parsing part as I already had a pretty good understanding of the EAF format due to my work on the search engine. After I finished the parsing + extraction + calculation part and finally showed some numbers on the GUI it was a great conclusion for the week! I went a little overboard adding various statistical analyses on the N-grams and realized that I couldn't possibly display them all in the GUI sanely. Again, my mentor helped me by making me realize that the GUI is not the place where most of the team worked in. They preferred to export the data into Excel then from there could massage the data to discover the answers they were seeking. That was a big relief for me as I didn't have to study more of the GUI code, ha! It was much easier to write the code to dump the data into a CSV file and have the team pick up from there. That meant I could continue adding MUCH more statistics to the code without fear of screwing up the GUI! From my research, I am only halfway done on the various formulas I wanted to implement, and I'm looking forward to continuing my work on them. Here's what the GUI looks like and a sample row from the CSV file:
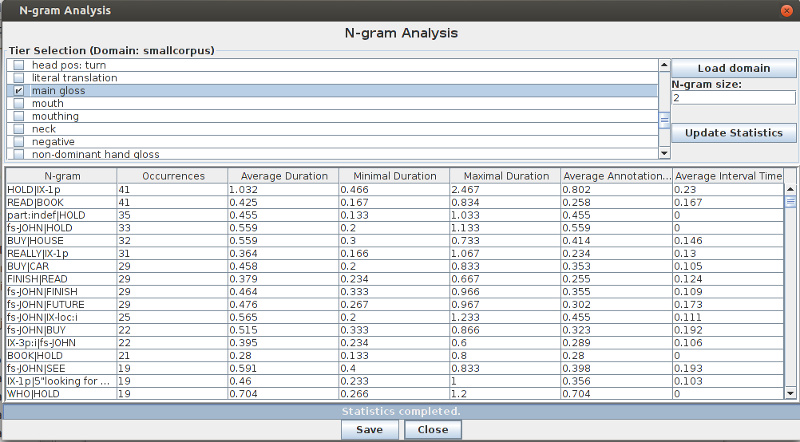
- N-gram: HOLD|IX-1p
- Annotation Time-Max: 1.566
- Annotation Time-Mean: 0.8024390243902438
- Annotation Time-Min: 0.3
- Chi-squared: 18.99563198053577
- Dice Coefficient: 0.0836734693877551
- Duration-Max: 2.467
- Duration-Mean: 1.0324878048780488
- Duration-Min: 0.466
- File Occurrences: 12.0
- Fisher Exact Left Sided: 0.9999733988140124
- Fisher Exact Right Sided: 5.767949813750839E-5
- Fisher Exact Two Tailed: 6.859018671364687E-5
- Interval Time-Max: 1.8
- Interval Time-Mean: 0.2300487804878049
- Interval Time-Min: 0.0
- Jaccard Coefficient: 0.043663471778487756
- Log-likelihood: 15.37899333303298
- Occurrences: 41.0
- Odds Ratio: 2.0695969580204796
- Phi Coefficient: 0.001745601174465702
- Pointwise Mutual Information: 0.9219876171415615
- Poisson-Stirling Measure: -14.798002189352918
- T-score: 3.023674434595006
- True Mutual Information: 673.4425132439579