|

|

|

|

|
Final Report: QPIPE Graphical Demonstation System
Project overview
The goal of this project is to create a web-based graphical demonstration system for the QPIPE Staged Database System. The demo system enables users to execute benchmark workloads, and measure and compare the performance of QPIPE, a prototype Staged Database System with that of a commercial DBMS, IBM DB2. The demo provides dynamic real-time graphical displays of performance metrics and QPIPE stage queue state.
The purpose of a Staged Database System is to break a Database Management System (DBMS) into modules and to encapsulate them into self-contained stages connected to each other through queues. The staged design remedies the weaknesses of modern DBMS by providing solutions at both the hardware level and the software level. At the hardware level, a Staged Database System optimally exploits the underlying memory hierarchy and take direct advantage of SMP systems. At the software engineering level, it aims for a highly flexible, extensible, easy to program, and evolve platform.
(Harizopoulos and Ailamaki, 2003)
System Architecture
User Interface
The user interface is implemented via a java applet. The demo system can therefore be run on any java enabled web browser. The applet communicates with the server through a network connection. There are two threads running in the applet (in addition to the main and garbage collection threads). One thread listens for user input, and responds accordingly. This thread also writes data to the server. The other thread reads data from the server and displays it graphically.
Server
The server is a Python script that communicates with the java applet and the frontend. The server handles network connection requests from the applet, parses lines of data read over the network, and calls subroutines in the frontend module. The server also writes the results of benchmark execution back to the applet.
Frontend
The frontend is a python script which serves as an abstraction layer between the server and the benchmark modules. The server calls subroutines in the frontend, including run, init, and stop. The frontend then calls the appropriate subroutine in one of the benchmark modules.
Benchmark Modules
Each combination of DBMS and workload has a python module which handles initialization and execution of the workload.
Currently, modules have been implemented for the University of Wisconsin benchmark on IBM DB2, and for TPC-C on IBM DB2. Modules for executing these workloads on the QPIPE Staged Database System will be created in the future, as well as modules for the TPC-H workload.
User Interface Functionality
A set of buttons is always visible. These current buttons include Configure, Init, Start, Snapshot, Log, ExecR, and ExecS. Pressing “Configure” processes the selections made by the user in the configuration panel, and initializes the performance graphs. “Init” initializes the system for the experiment the user has configured. This process may include creating a database, generating data, and loading it into the database. “Start” begins execution of the workload. “Snapshot” stores a copy of the current performance graphs. “Log” displays a dialog containing a scrollable textual log describing the applet's activity. This feature is especially useful for debugging during development. “ExecR” displays a random set of data in the QPIPE execution panel, which visually represents stage queue state. Each click on “ExecS” displays a simulation of two queries moving through QPIPE stages.
The user interface contains a panel with 4 tabbed panels: configuration, performance, execution, and snapshots. These panels are described as follows.
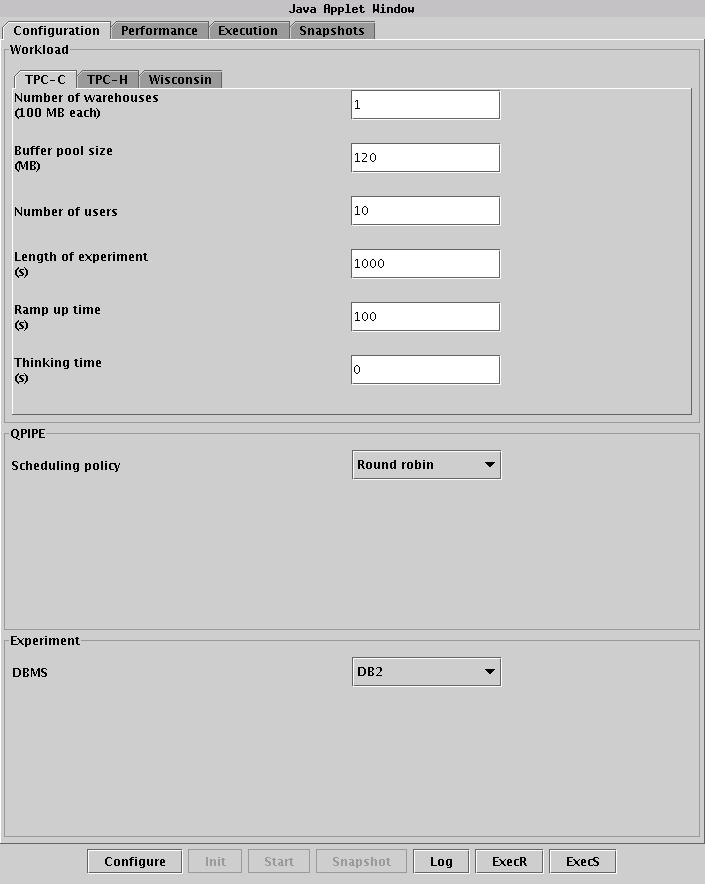
Configuration
The configuration panel enables users to select experimental parameters. For instance, users can choose the DBMS on which to run the experiment, the workload to execute, and the parameters specific to the selected workload.
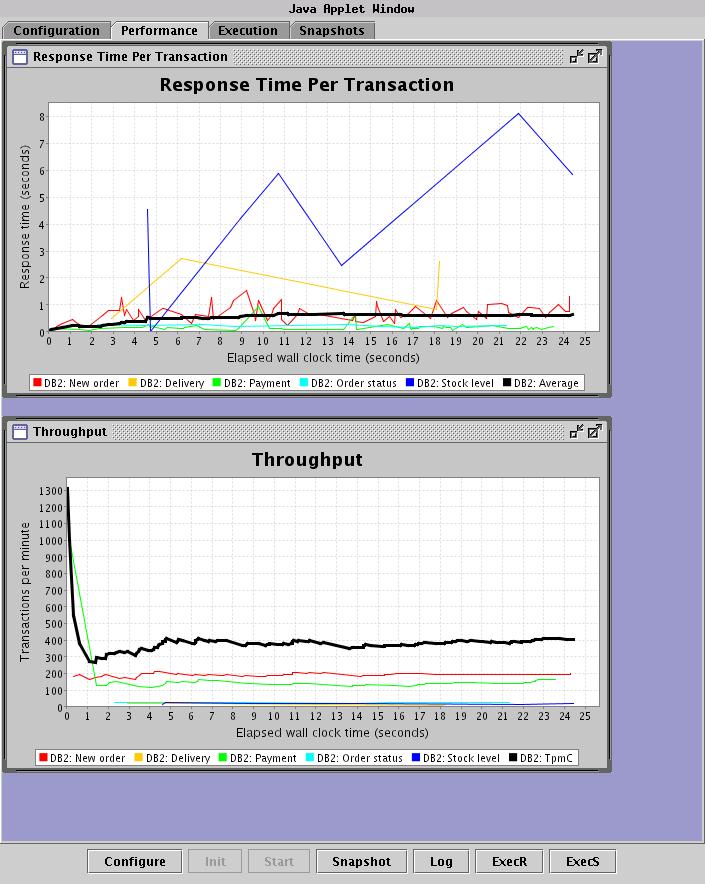
Performance
The performance panel displays dynamic graphs, which vary according to the workload. The graphs for the University of Wisconsin benchmark display actual response time for each query, average response time and throughput. The TPC-C graphs display actual response times per transaction by type, average response time, throughput per transaction by type, and transactions per minute (TPMC).
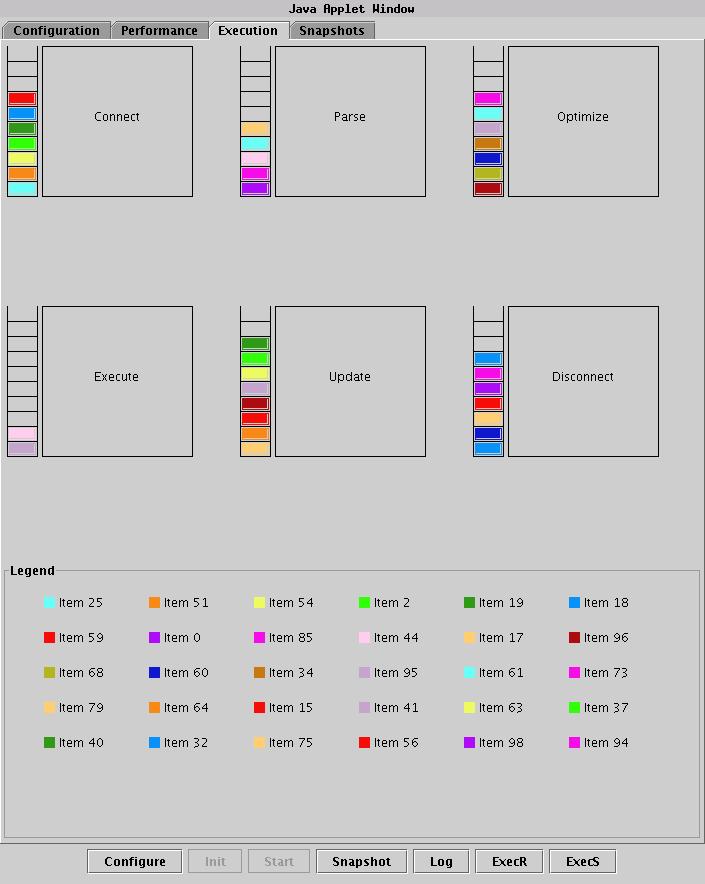
Execution
The execution panel displays QPIPE stage queue state. The data is currently simulated. Each colored rectangle represents an item (query or transaction) contained in the given QPIPE stage queue.
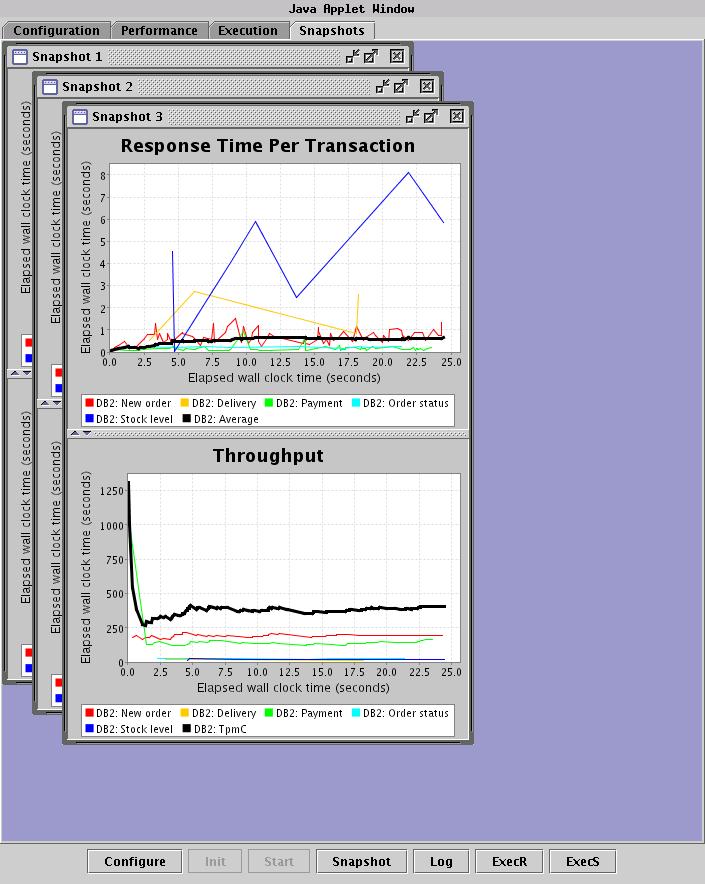
Snapshots
The user can take snapshots of the current performance graphics, and view them in the snapshot panel.