|


| |
Research Journal
|
Week 1: |
At the beginning of the week, I looked at some genome visualization
websites that Professor Grimm sent to me, and learned about what the genome
maps looked like and some of the techniques for creating them. It was
interesting to see the different features, such as zooming and rotating.
Professor Grimm and I also met with Professor Buhler, who told us about the
genetic data he had and how it could be visualized. We established the
project: I'll take his E. Coli genome and operon data and display it as a
circular genome map, with the ability of fish eye zooming. I read
"Achieving Higher Manification in Context" by Sheelagh Carpendale
to learn more about fisheye zooming (or focusing in context). Once I
had an idea of what I needed to do, I started out by creating a grid mesh
and warping it by pushing a hemisphere portion from the center of the mesh
toward the viewing point.
|
|
|
|
Week 2: |
This week I continued to work on the grid mesh and the fish eye warp.
I finally figured out which mesh and camera classes and methods I needed to
use! I had been using the wrong ones and made things much more difficult
for myself. I learned how to create a mesh by writing to a .m file,
then began working on texture mapping an image to the mesh. I started
out by just finding a genome map image and mapping it onto a square mesh.
After I got that to work, I worked on texture mapping the image to the grid
mesh, which was a bit harder since it had so many faces. When that was
done, I wrote a warp function for the mesh.
|
|
|
|
Week 3: |
I have made a lot more progress this week. I began thinking about
the user interface, specifically how the user will be able to choose the
place on the map to warp. I created four buttons (up, down, right, and
left), a zoom slider which increases the amount the mesh is warped toward
the viewer, and a radius slider which increases the radius of the warped
part of the mesh. I also put in two buttons for the user to choose
which genome they want to see, because Professor Buhler sent me genome data
from two different organisms, E. Coli and Btheta. Once this was done,
I worked on parsing the data files. I decided to start with the E.
Coli file and finish all the visualization stuff for that file before I
worked on the other one. I'm not sure if I parsed the file the most
efficient way; I ended up storing each gene attribute in a different array,
so that I could access the location, COG, length, etc. with the same id
number.
|
|
|
|
Week 4: |
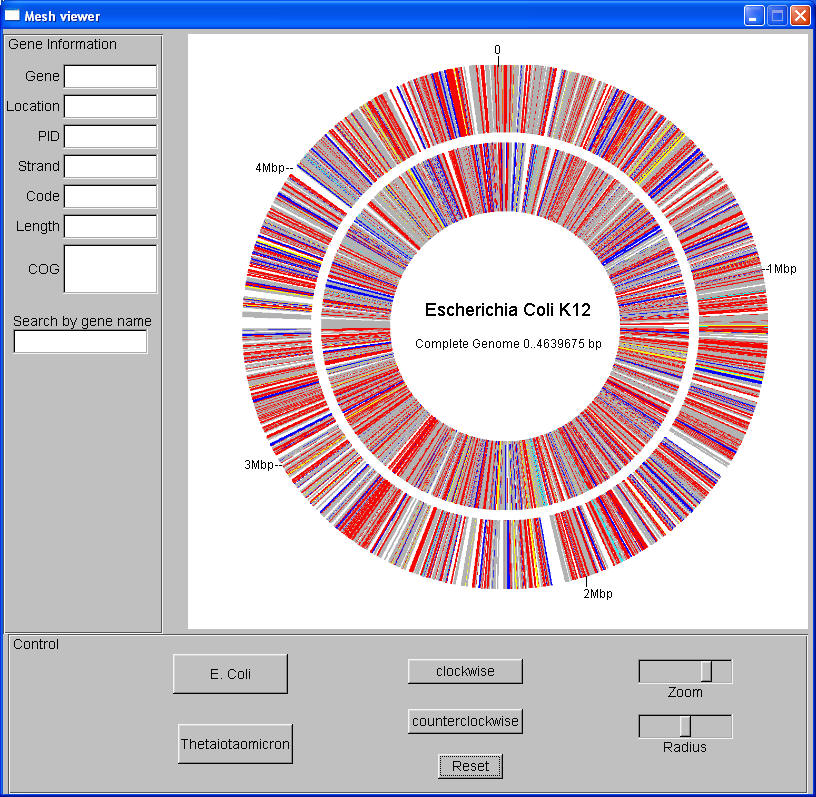
I added several more features for the user interface. On the left
of the genome map, I made text fields that output the gene information.
I also changed the directional buttons into two buttons, clockwise and
counter-clockwise. When moving around the map, the gene number is
incremented and the gene's information is shown in the text fields. Next I
began constructing the genome map from the parsed genetic data. This
was harder than I thought, because there are over 4,000 genes, so it was
hard to fit all of them onto the map. I looked at a couple sites to
see what other E. Coli genome maps looked like:
http://www.cifn.unam.mx/Computational_Genomics/regulondb/HtmlDocs/ECK12_ZoomTool.html
http://www.genome.jp/kegg/docs/slides/tutorial2/gp04.html
Once I had a map that looked similar to these, I added a search feature,
so that when a user enters a gene name, the gene's information is displayed
and the mesh is warped at the gene's location. Here is a screen shot
of the genome map so far:
|
|
|
|
Week 5: |
This week I worked on parsing the Btheta file and visualizing its data.
I had to make many alterations to my code, since I originally just wrote it
for the E. Coli file. I definitely need to work on my coding style in
order to save time! I wrote a GenomeMap class that would store the
file names and arrays of the genes' information, so now it won't be very
hard to add more files to visualize. Once I had created the Btheta
map, I decided to work on making my program faster, since it took about a
minute and a half to read both files and create the texture maps. I
found where the slowest parts were and made some changes, and now it takes
about 25 seconds to read the files and build the texture maps. I also
tried to improve the zooming feature, because when the mesh is warped it
isn't pushed out exactly toward the user, since the look-at position is at
the center of the mesh, not at the center of the warped part. So far I
haven't found a good solution.
|
|
|
|
Week 6: |
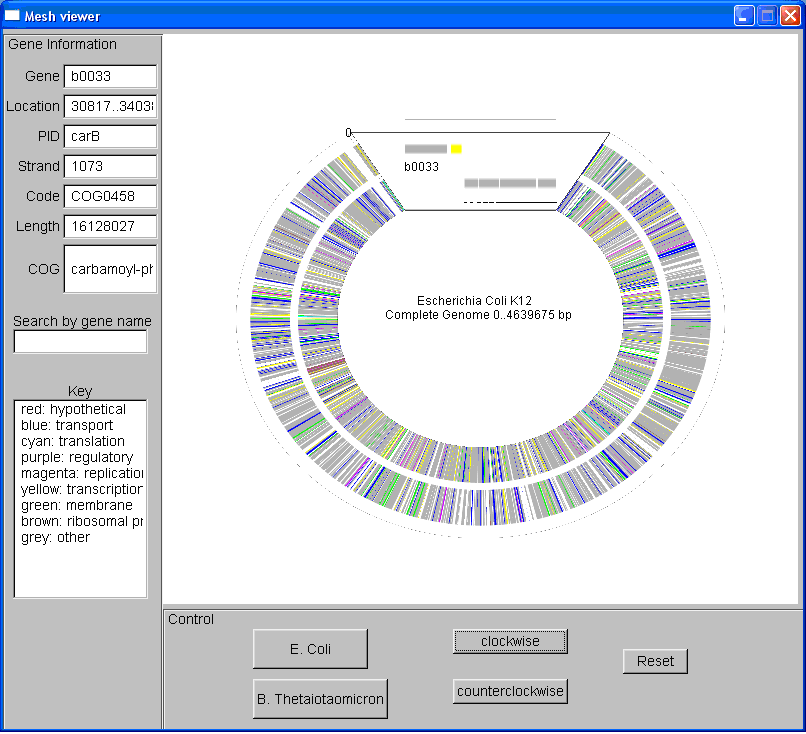
At the beginning of the week, I added a couple more features. I
finally added a key, and when a user searches for a gene, a line will point
to its location and the gene is labeled with its name and direction.
Next, I worked on the warping function, because it still does not zoom in on
the genome enough, and it also does not point toward the viewer. I
talked to Professor Grimm about this, and she suggested that I find the
vector from the warped point to the viewing position and use this in the
warping function. She also suggested using orthogonal projection
instead of perspective. On Wednesday, we showed Professor Buhler what
I had done so far, so that we could get some input on what additional
features would be most useful for genome research. He showed me the
UCSC Genome Browser, which is an incredible tool that displays a lot of
details and comparisons of genomes. Some data that could be added to
my tool could be GC content, gene expression, and operon predictions.
Some of the data could be shown on the zoomed out map, and more detailed
data could be shown on the zoomed in portions of the map. Professor
Buhler also said that it would be useful to allow multiple zoomed-in views
of the genome to be displayed. However, before I add these features, I
need to fix the warping feature. Professor Grimm and I decided to try
something new that would not warp the mesh in the z-direction. I made
a lot of changes: I changed the projection from perspective to orthographic,
and I changed the grid mesh into a circular mesh and texture mapped the
genome data onto it. This definitely saved time in building the mesh
and texture maps, and it looks exactly the same as it did before. Now
I am working on selecting an area in the genome to translate to the origin,
rotate, scale, then put back, which is one of the new methods of warping the
image.
|
|
|
|
Week 7: |
I had some trouble with the zooming at first. I wasn't really sure
how to take a part of the circular mesh and texture map and scale it.
After some failed attempts and then talking to Professor Grimm, I finally
got on the right track. I had to change the DrawTexture method, so
that when it was drawing each face it would find all the faces to be warped
and scale them to be bigger. I also had to play around with rotating
and translating the faces, so that the faces would be in a good location and
would not look warped. Next, I fixed some of the problems with the
texture map, because I realized some of the genes were not being drawn and
some were not in the right place. Finally, I fixed the zoom slider and
radius slider so that now they will work for the new warp. Next week,
I will try to push out the part of the mesh that is hidden when the scaled
faces overlap it, so that all of the map can be seen. Then I will work
on labeling the genes.
|
|
|
|
Week 8: |
I first worked on increasing the resolution of the genome map, because
the genes are very squished and it is hard to distinguish between each
separate gene. So far I haven't been able to increase the width of the
image to more than 2^11, because for some reason the texture mapping won't
work. I wanted to see if it would look a lot better at 2^12, so I
divided the circle mesh and the texture maps into halves, with the width of
each texture map at 2^11. It did look a lot better and would be much
easier to label at this resolution. However, having the mesh in halves
causes everything to be a little more difficult, especially wrapping.
So I think I'll work on increasing the resolution once I have finished the
"squishing" and the labeling. Next I worked on the "squishing" part,
where I am moving the faces of the mesh so that all of the map can be seen.
First, I decided to figure out the exact vertices of the face after it had
been scaled, translated, etc. This was a little difficult, since I had
so many transformations. After I had these points, I could find out
which faces were overlapped by the scaled face, and then move those.
However, once I got those points, I wasn't sure how exactly I should move
the faces in between. Professor Grimm helped me out and now I have a
better idea of what I need to do. We also discovered that the scaling
was warping the face a little bit, so I needed to scale the face from its
center point, instead of one of its vertices.
|
|
|
|
Week 9: |
I finally got the squishing to work: I ended up creating a new mesh with
the altered vertices, then in the DrawTexture method I check each face to
see if it should be altered, then switch the face at that position with one
of the altered faces. Next, I had to incorporate the zoom and radius
functions into the altered mesh. This took a while to play around
with, because as the warped face changed size it would start overlapping
other faces. I mostly fixed this, but it's still not exactly perfect.
Here is a picture of the map after the radius and the zoom have been
increased:
All the faces in the map are visible, which was the original goal.
Next, I need to figure out a way to label the genes, and then I want to get
the search function to work again.
|
|
|
|
Week 10: |
In my last week, I altered the way the genes were displayed by creating a
zoom window instead and rotating the entire genome map when the directional
buttons were used. The zoom window is a separte mesh and texture map,
where I determine which genes should be displayed in the window and
redrawing them at a higher resolution. Now it is much easier to view
the genes and label them. I then verified that the genes were in the
correct location and were the right length. I am still working on a
mouse function where the user can click on the part of the genome map and
the face is displayed in the zoom window. The map now looks like this:
|
|
|
|
|
|