|

|

|

|

|
Week 2 (June 9 - June 13)
Week 3 (June 16 - June 20)
Week 4 (June 23 - June 27)
Week 5 (June 30 - July 4)
Week 6 (July 7 - July 11)
Week 7 (July 14 - July 18)
Week 8 (July 21 - July 25)
Week 9 (July 28 - August 1)
Week 10 (August 4 - August 8)
I arrived in Pittsburgh and got settled in my sublet apartment. Then, I met my CMU colleagues, who have all been very friendly. We discussed the project I'll be helping with this summer - a staged database system. My part of the project will involve creating a web-based user interface for the system, to run various workloads and then view information about the performance and execution of the system. We discussed some preliminary goals and plans, and I did some research regarding implementation ideas. I found an excellent open source package (JFreeChart) which I suspected would be very userful for creating dynamic graphs. I configured my workstation and installed the apache web server for testing and development.
Most of the other members of our research group went to the SIGMOD conference. So, my fellow DMP participant, Agata Bugaj, and I held down the fort.
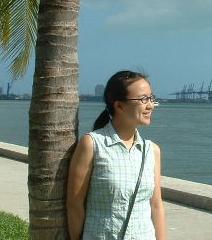
 This is Agata!
The CMU graduate students that Agata and I work with most are Stavros Harizopoulos and Vladislav Shkapenyuk.
 This is Stavros!
This week I developed a prototype of the performance graphing application. I researched several possible ways of saving state so that users can compare data and regenerate associated graphics from several executions of the system. For instance, we can serialize the data, or encode it with XML. I created the initial prototype as an applet, but have run into some security restrictions. I would like to write and read files, but applets do not allow this functionality. So, I am researching alternatives, such as Java Web Start. I also did assorted background research into swing, applets, XML, java server applications / sockets, Python, java web start, and threading.
I've made some changes to the latest version of the QPIPE applet, and the pieces of our model system are starting to come together. The applet now opens in a new window, and the graph in the "performance" panel opens in an internal frame which can be resized independently of the outer window. I added some dummy options to the configuration panel, plus a "clear" button for the graphs. I spent some time reading a Python tutorial, and created a small server script which basically generates random numbers. The applet now connects to the server over a socket, reads in random numbers, and graphs them dynamically. This is all sort of a skeleton or foundation for the functionality we hope to provide in the finished application, which will connect to one or more databases. I'm still not sure how I will handle saving files and running executables on the host machine (applet security restrictions - grrr). Next up: more graphs, more servers, improving the GUI layout, making all the pretty buttons actually do things.
I met Lenore Blum, a professor here in the Computer Science Department. She started the Math and Computer Science Department and the Interdiscplinary Computer Science graduate programs at Mills College. I just finished the first year of the ICS program, so thanks Lenore! She's also very involved with Women at SCS and invited me to attend one of their meetings next week.
Check out the latest version. There are now two graphs (average response time and average throughput) with two datasets displayed on each (QPIPE and DB2). The data comes from two seperate python server scripts, however the server is still just sending random numbers. I did some reading on using with python, and it appears pretty straightforward.
On Thursday and Friday, Agata and I attended the Aladdin College Workshop. We heard some interesting talks, and met students and faculty from various universites across the country. The highlight was dinner at Lenore and Manuel Blum's house, and Steven Rudich's magic show. I have never before been served wine by a Turing Award winner.
This week, I added some functionality to the applet so that the user can take snapshots of the various charts during workload execution. There is an additional tabbed pane for snapshots, and when the user clicks the snapshot button in the performance pane, a copy of the chart is displayed in an internal frame in the snapshot pane. Hopefully, somewhere down the line I will add the ability to save chart snapshots as image files. While it would normally be a simple matter to save a file, applet security restrictions make this more challengeing.
I met with Minglong Shao, one of the local grad students, and gave me some pointers on using DB2. I tried to install the python DB2 module on the development machine I'm using, but ran into a couple of roadblocks (permissions, dependencies, etc.) which will hopefully be resolved within the next couple of days. Next Tuesday I will meet with Natassa to discuss our midway-point progress report. I can't believe how fast the time is going by!
Agata and I participated in another Women at SCS outreach event for high school teachers.

Friday was the 4th of July, so we went to see fireworks at Point State Park.
I made some improvements to the applet GUI. The configuration panel is now laid out nicely (no giant buttons!), and both graphs (response time and throughput) are displayed in snapshots. The frames which pop up inside the snapshot panel appear slightly offset from each other, and then wrap around when they run out of space on the right hand side of the panel. Each snapshot frame contains two graphs inside a split panel, and each graph can be resized within the frame.
I transferred my development environment to a different machine, and installed the necessary software. I installed and configured the Python DB2 module, as well as a DB2 client. I created a test python script which connects to the database and executes various statements and queries. I began working on implementing the Wisconsin benchmark.
We came up with a general design for the system architecture. The applet will communicate with the server, the server will communicate with a "frontend" abstraction layer, and the frontend will communicate with various benchmark modules. I began developing the frontend and the Wisconsin DB2 benchmark module.
I improved the applet thread synchronization. I also added a logging feature. When the user clicks on the "log" button, a dialog frame will be displayed. This frame will contain a scrollable textual log of the applet activity. Also, I improved the snapshot display, so that each snapshot is placed on top of the last, shifted over slightly, wrapping around when the snapshots exceed the frame's horizontal boundaries.
I created the Wisconsin DB2 benchmark module. This python script supports initialization and execution of the University of Wisconsin benchmark workload. Initialization includes the generation of data, creation of a database, and loading of data. Execution includes running queries and returning response times.
I modified the applet / server communication, so that only one network connection is required. Previously, the applet would make two connections: one for QPIPE and one for DB2.
The applet configuration panel now provides the correct configuration parameters for the Wisconsin workload, and the applet performance panel is able to display the Wisconsin query response times and throughput.
I executed the Wisconsin benchmark via the applet, and began graphing real data. This was a very exciting moment!
Agata created the TPC-C DB2 benchmark module, and I began modifying the applet to support it. I added the parameters for TPC-C to the configuration panel, and modified the performance panel to support response time and throughput graphs for this workload. Each graph displays 6 lines: 5 for actual times, and an additional line for either average (response time) or total (throughput - TpmC).
I began creating the execution panel, which displays QPIPE stage queue state. I created three java classes: Stage, StageLegend, and StageLegendItem. Each stage contains items, represented by colored rectangles, in a queue. An item may represent a query or transaction being processed by QPIPE. The legend displays a map of item colors.
This week has been very busy. I've been working on the QPIPE execution panel, implementing new features, and putting various finishing touches on the user interface. I added a "configure" button to capture the user's selected experimental parameters. Also, Agata and I plugged the TPC-C benchmark module into the system, and began graphing real data from TPC-C in the applet.
Check out some snapshots of the applet.
I met with Lenore Blum to discuss graduate school, and with Manuel Blum to discuss his current research on consciousness. He would like to develop conscious robots. Agata and I also helped out with another Women@SCS outreach roadshow. And last but not least, I celebrated my birthday.
Thanks to everyone who has helped me with this project!
