Welcome to my 2018 DREU website!
-
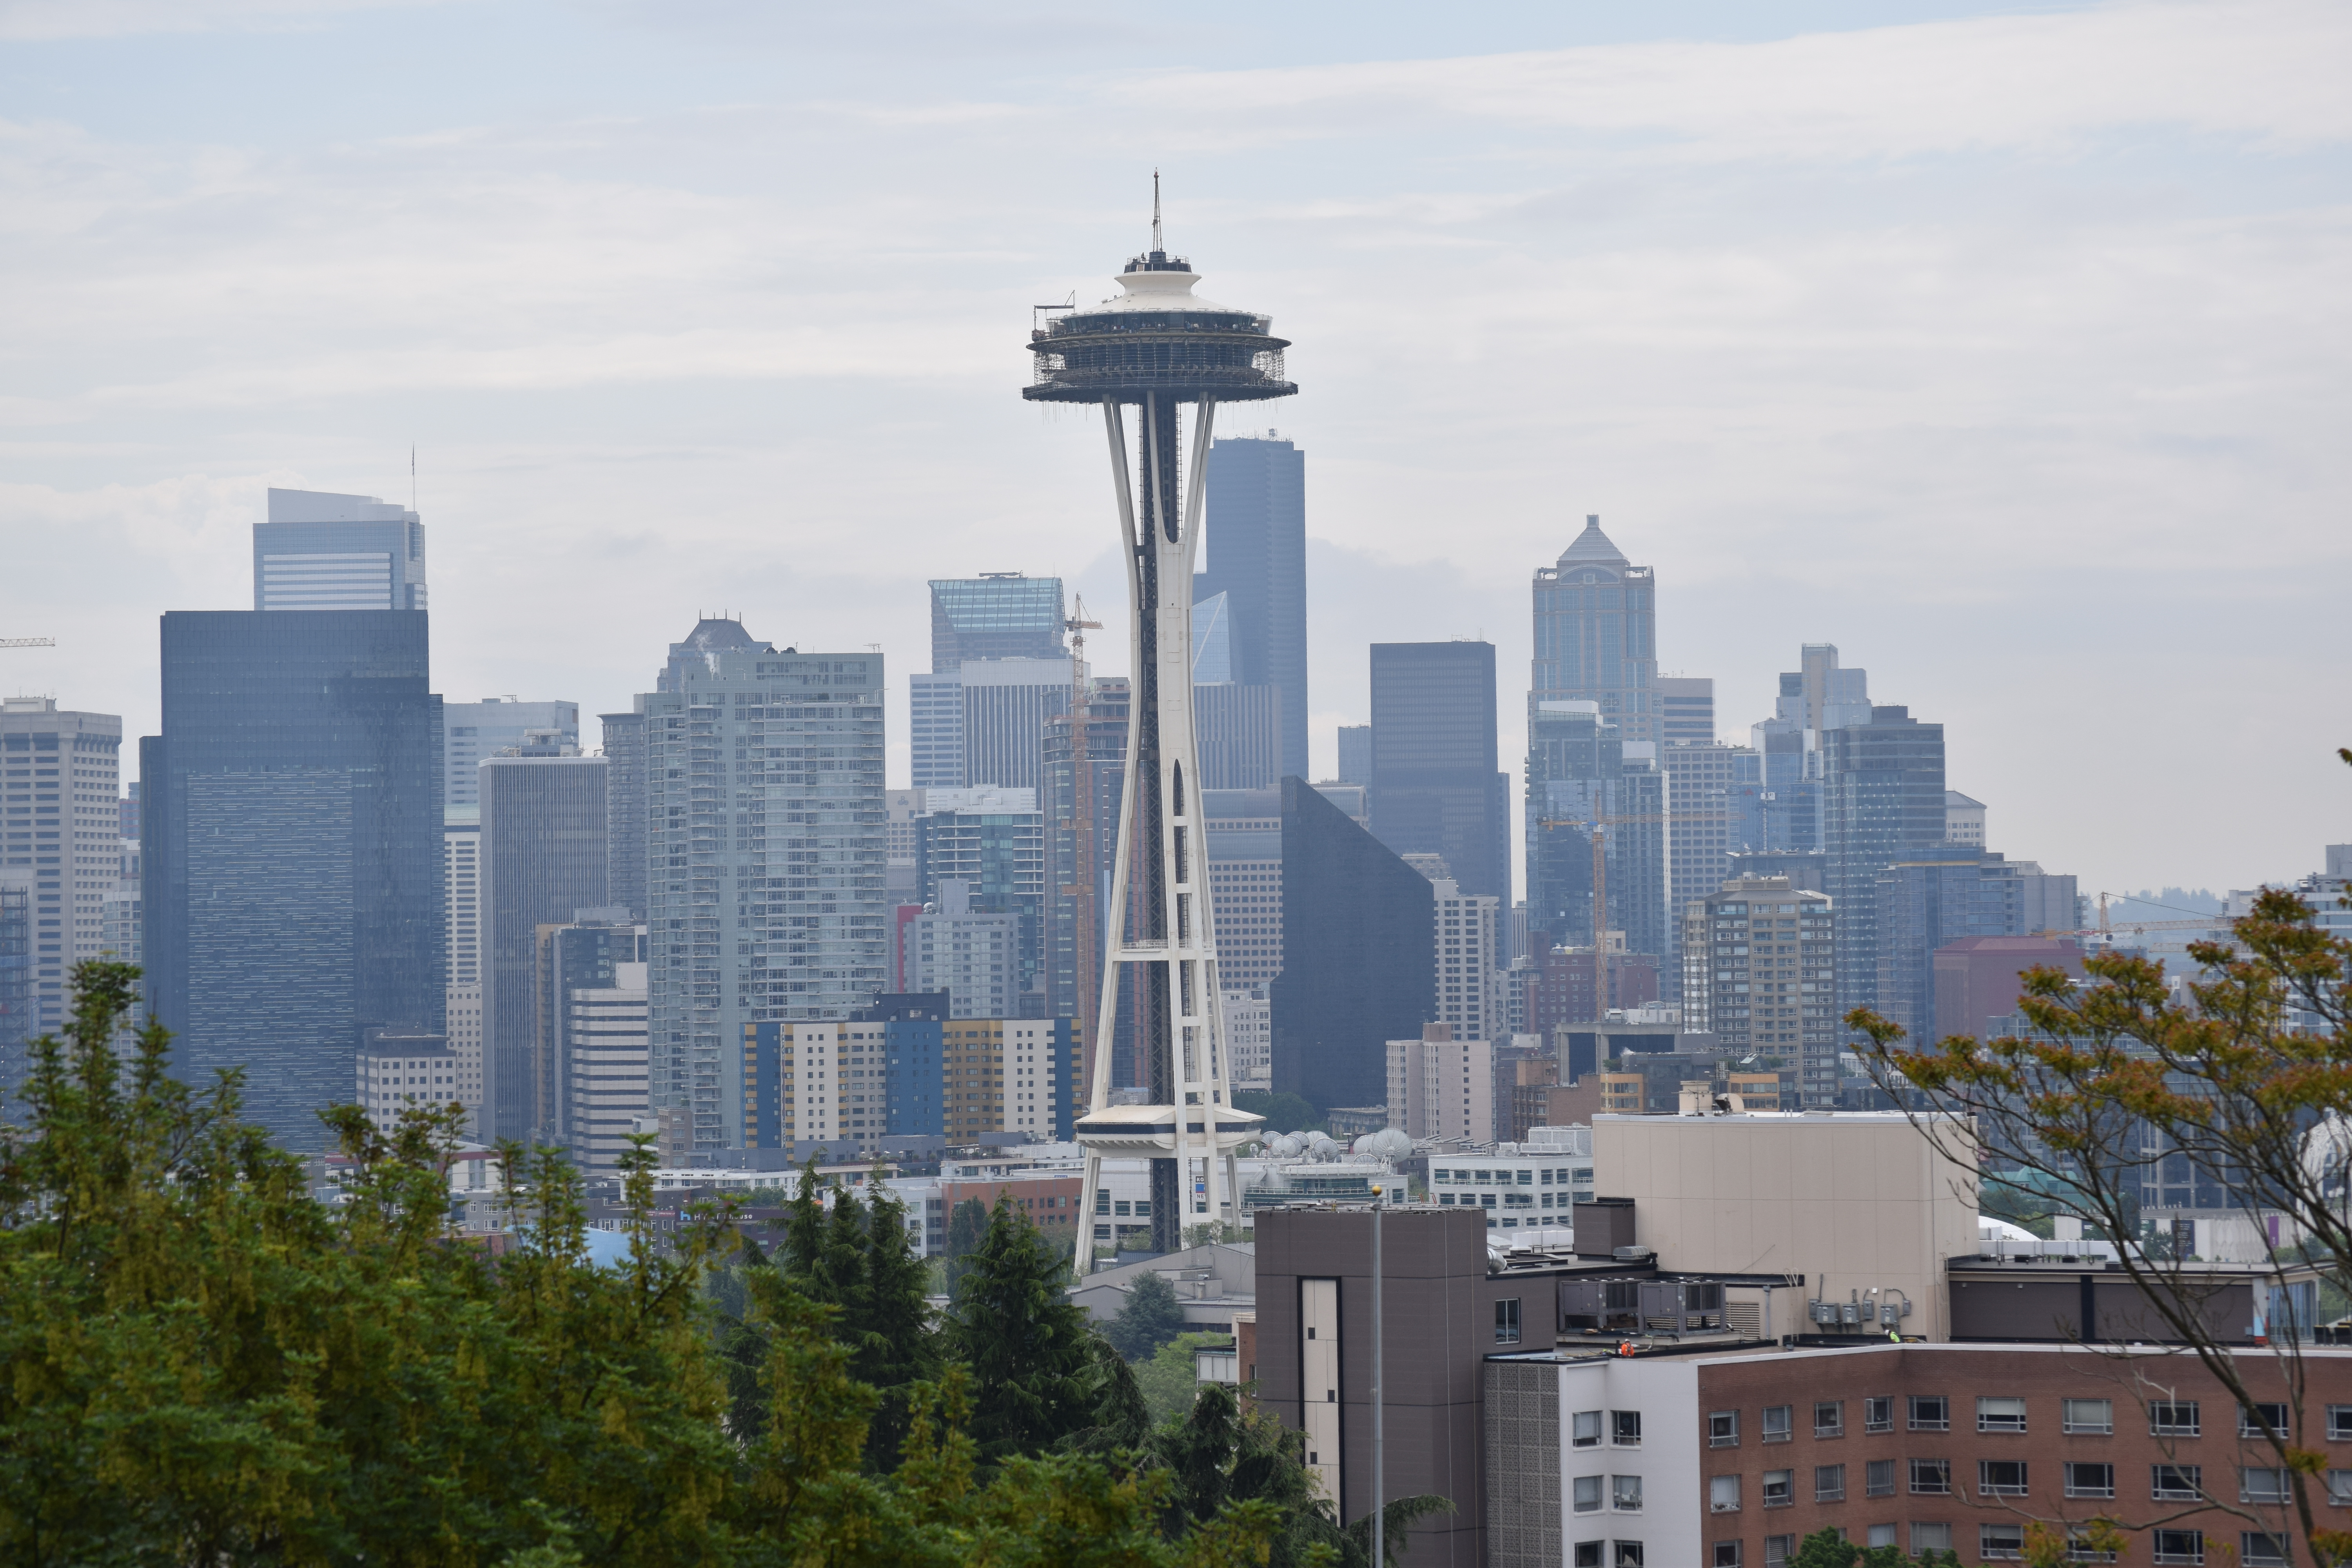 Kerry Park
 -
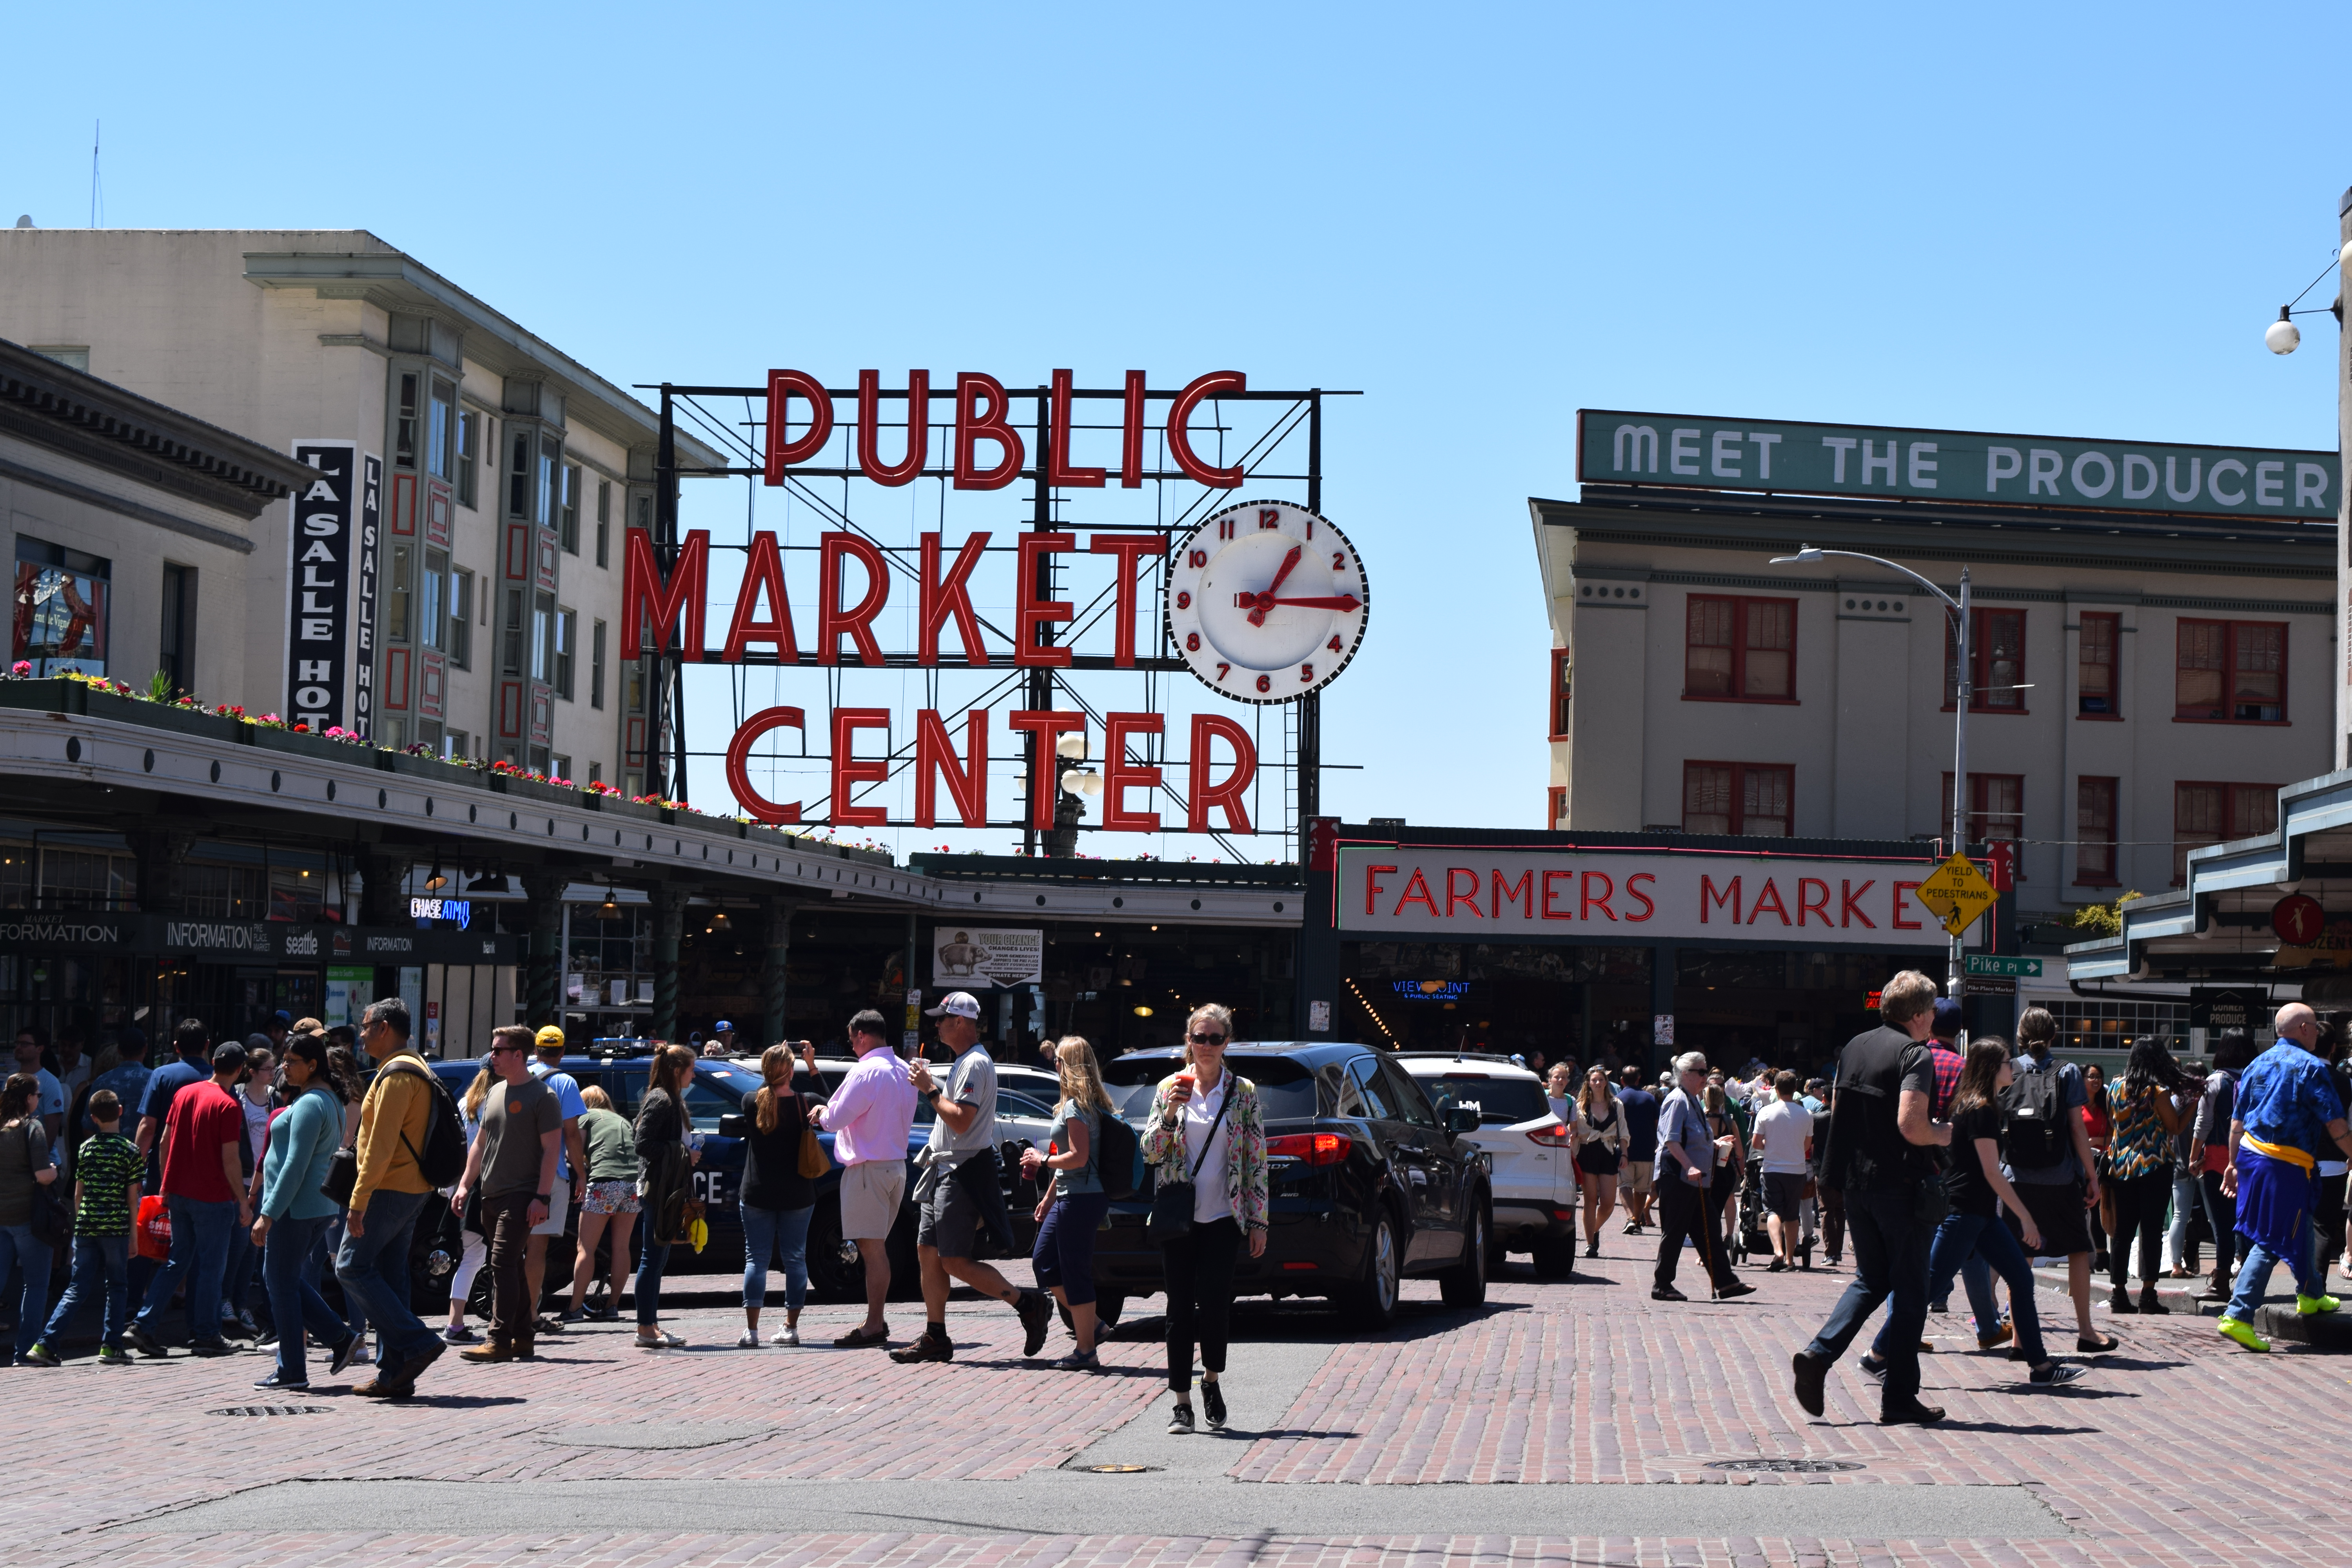 Pike Place Market
Welcome to my 2018 DREU website!
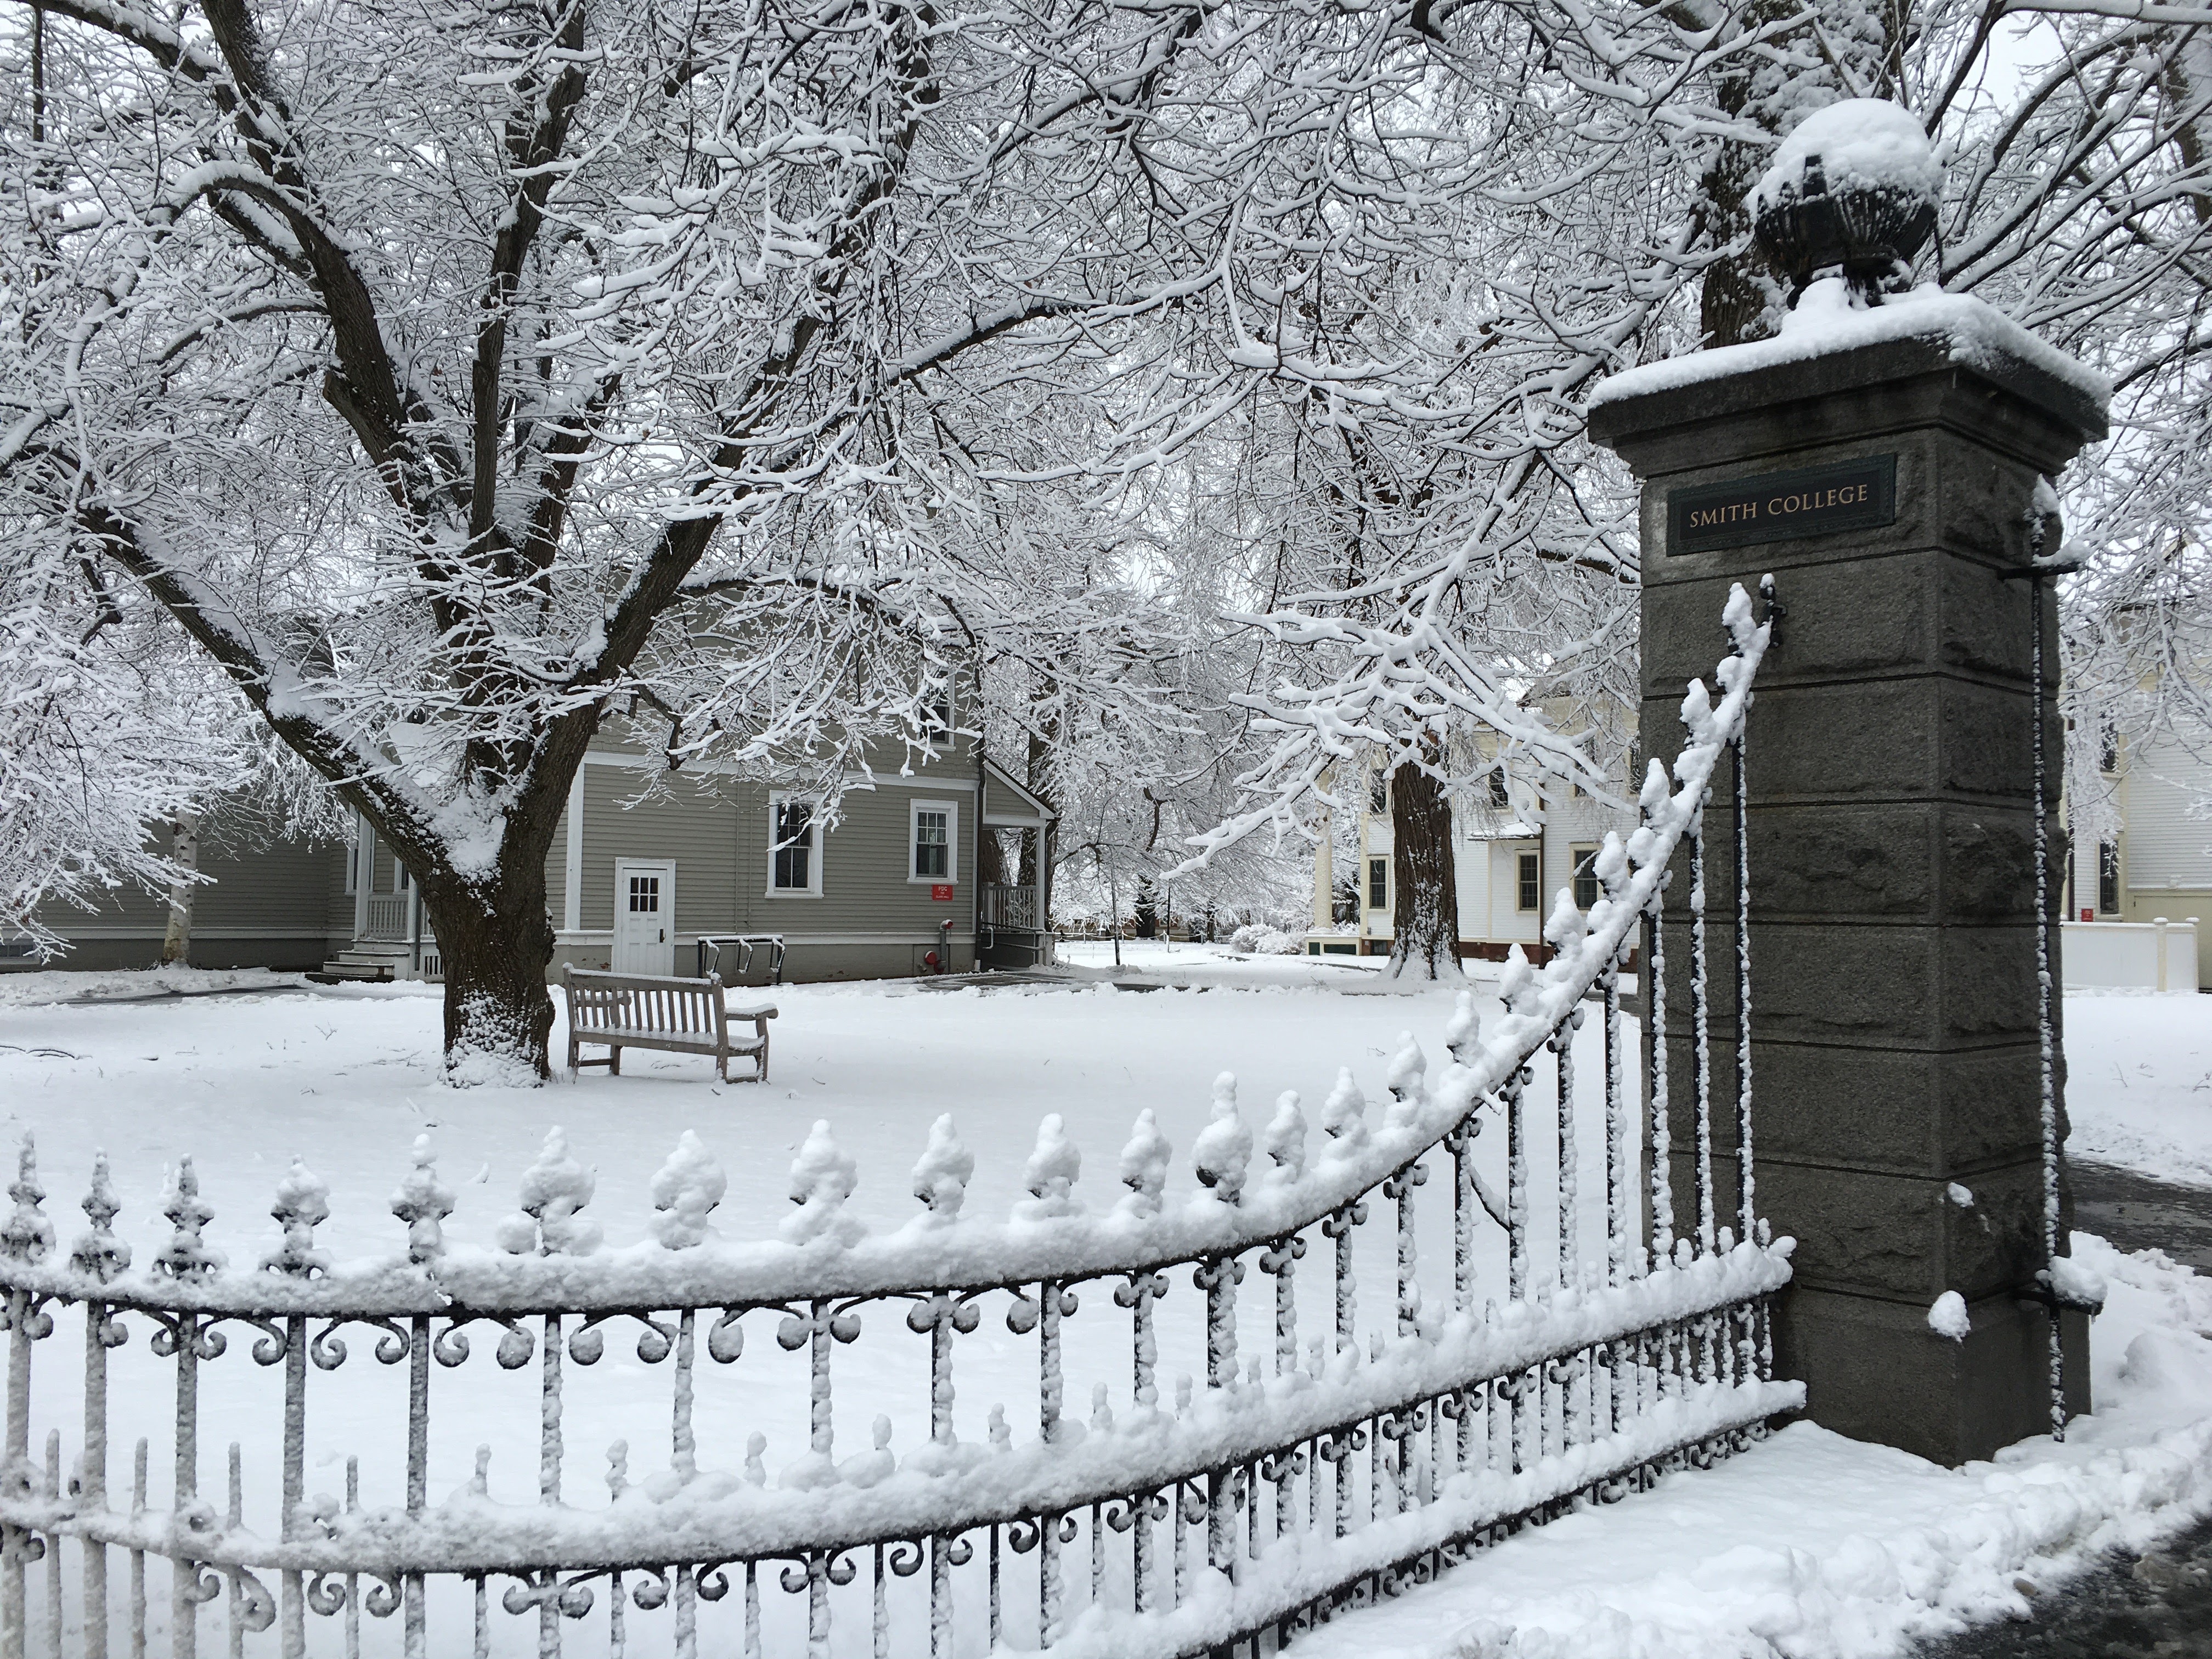
My name is Emmely Rogers. I am a mathematics and computer science double major at Smith College in Northampton, MA. I will graduate from Smith in May 2019. My ten week 2018 DREU experience is taking place in Seattle, WA. In my free time I enjoy taking photographs, playing Candy Crush, and eating mint chocolate chip ice cream.
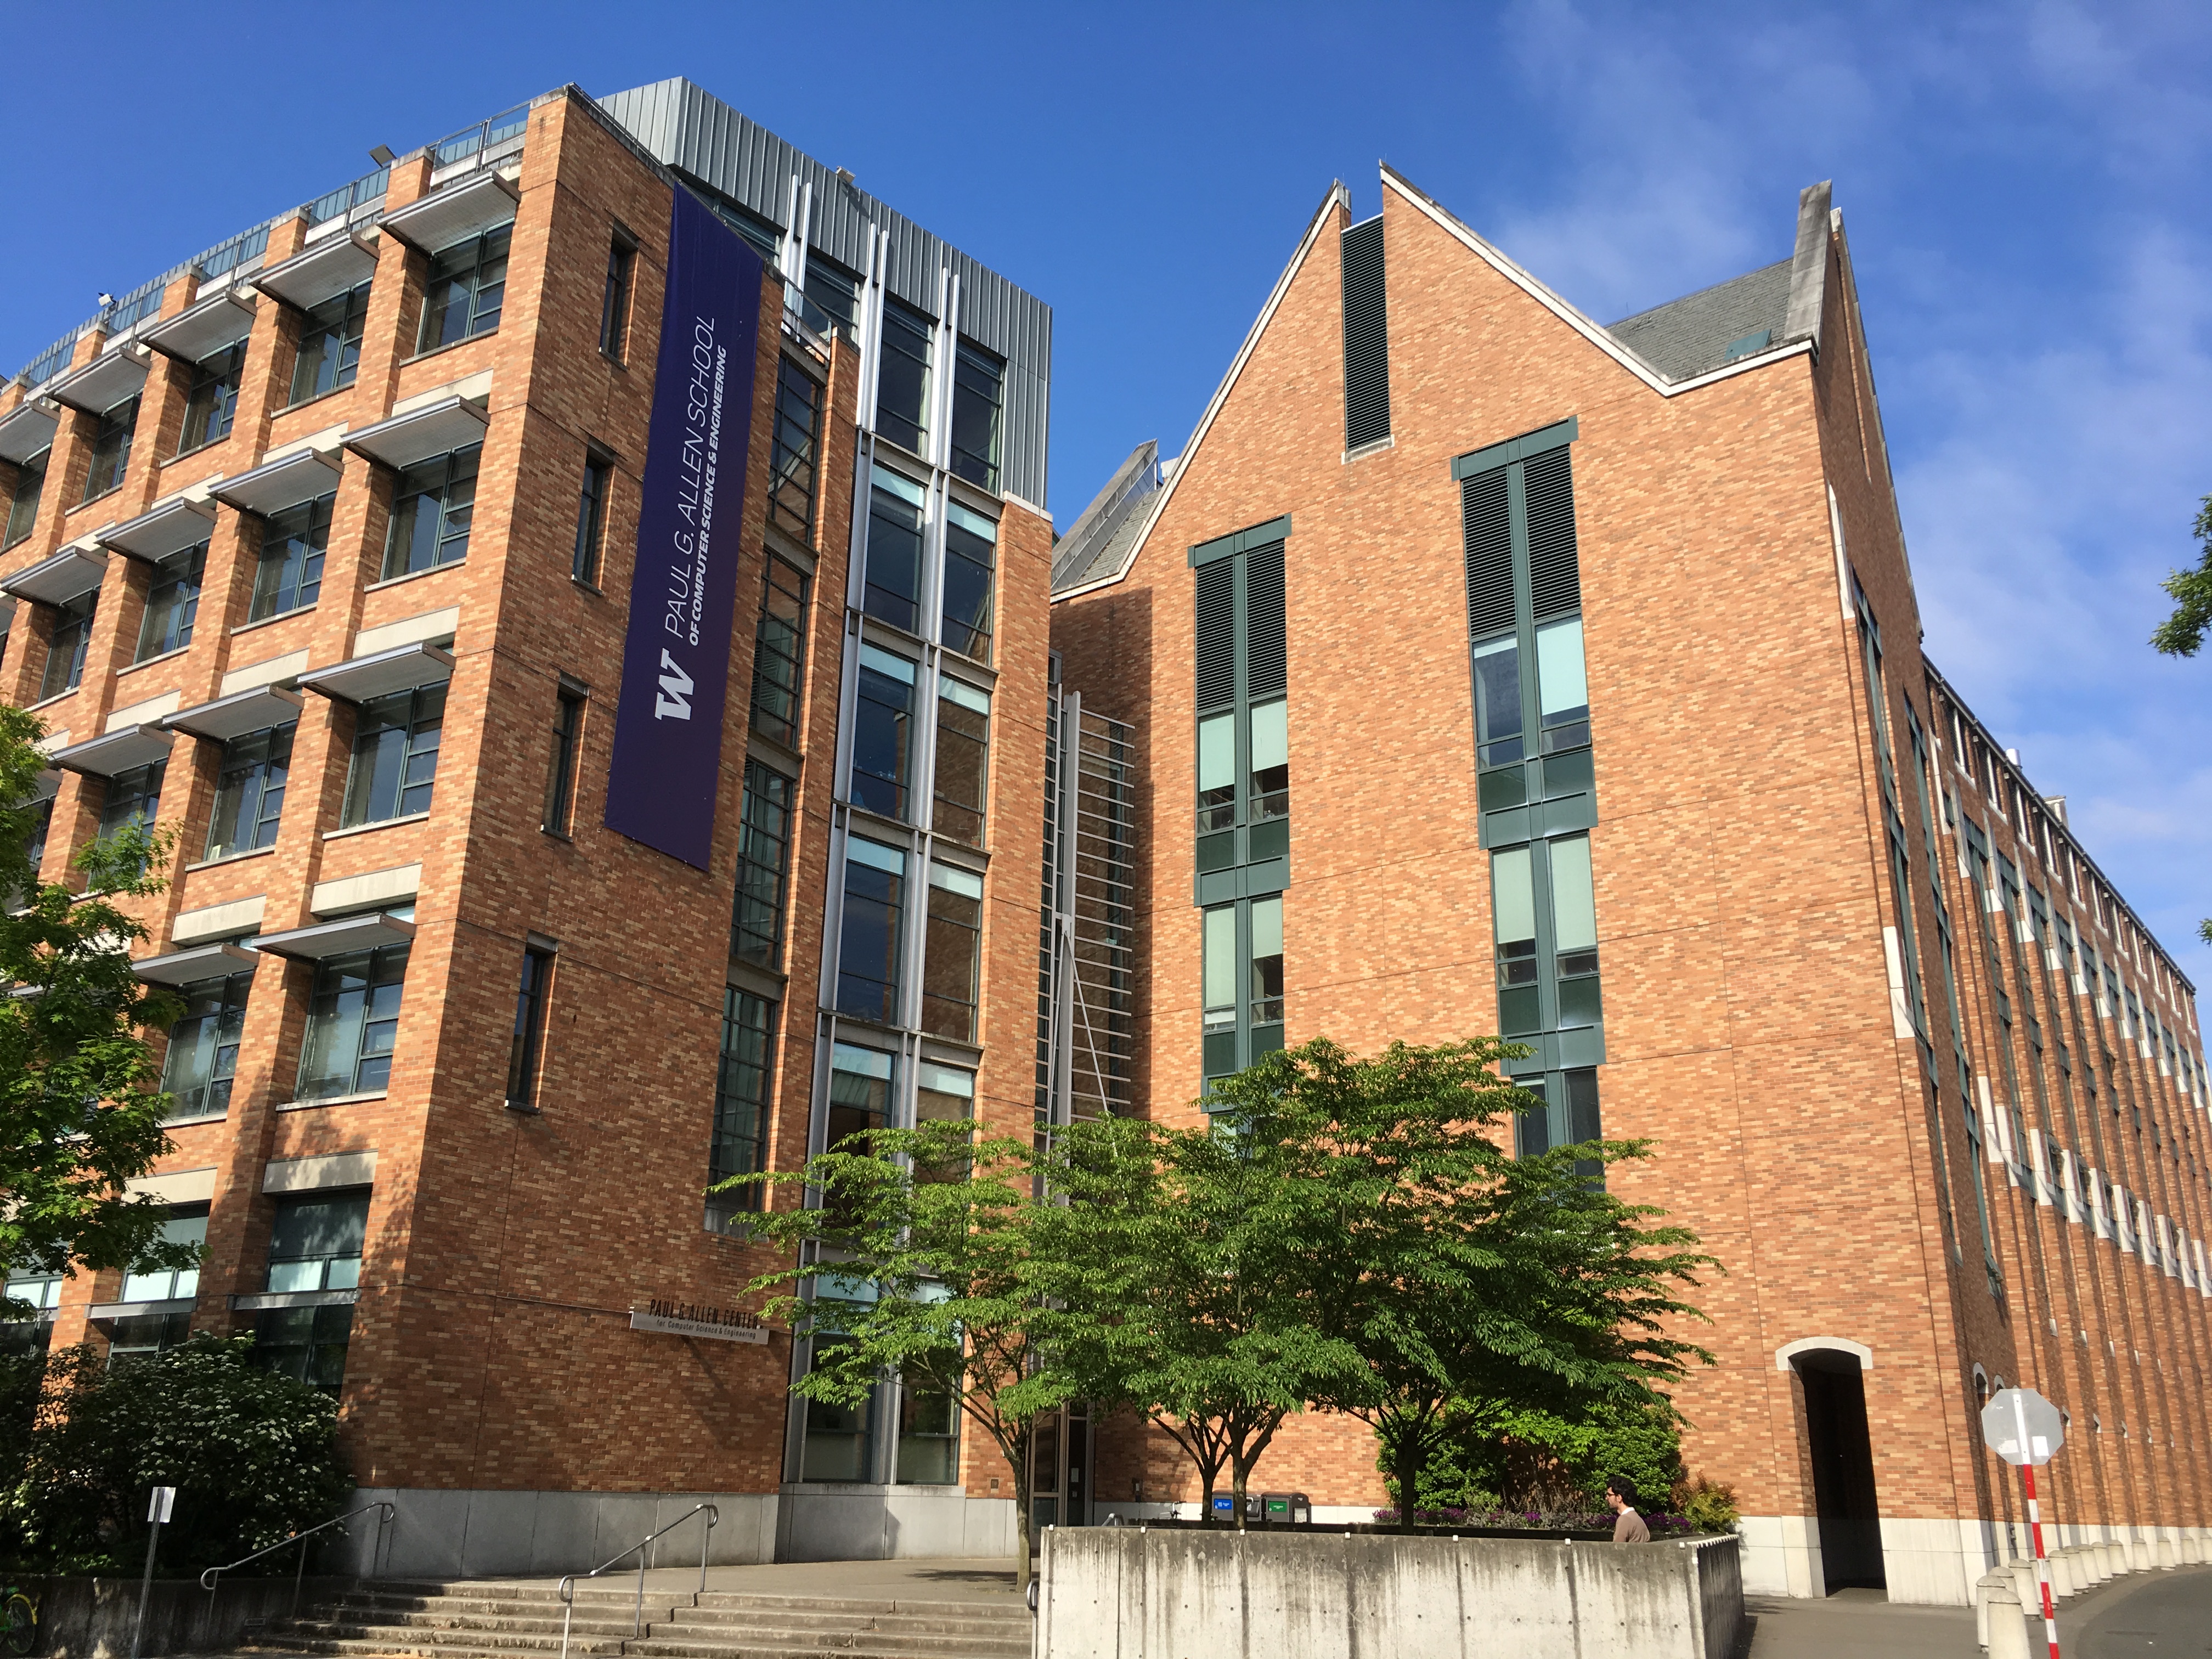
This summer I am working with Anna Karlin. She is a Microsoft Professor of Computer Science & Engineering at the University of Washington. Her area of research is in theoretical computer science, with a focus on algorithms.
Anna helped me find housing with Jennifer Mankoff, another professor from the department, before UW's summer quarter begins and I can move onto campus.
The project sits at the crossroads of economics and computer science. It is a continuation of research that has been done by Anna and others. The research is focused on designing mechanisms to determine which seller will be placed in Amazon's Buy Box and studying how this decision affects the market. So far, the mechanisms that have been studied are the Lowest Price First mechanism, Random mechanism, Threshold mechanism, and Exponential mechanism. For all mechanisms, best response dynamics was used to determine seller behavior.
In the Lowest Price First mechanism the seller with the lowest price is placed in the Buy Box (ties are broken randomly). In the Random mechanism the seller placed in the Buy Box is chosen uniformly at random without considering prices. The Threshold mechanism only considers sellers who have a price less than or equal to the threshold parameter and chooses one of them at random. In the Exponential mechanism the probability that seller i (with price pi) is placed in the Buy Box is e-αpi .
The goal for this summer is to expand upon the experiments already conducted and evaluate the results. I have access to the Python program that has been created for the previous experiments, so I will be working on extending this code. Currently, the code only allows for two sellers. The first addition is to incorporate a production cost for each seller. Another extension is to continue using two sellers, but draw the buyer's value for each seller's item from two different distributions. After these steps have been completed, the next objective is to be able to experiment with more than two sellers.
During the first week I focused on understanding more details in the paper that the project is based upon and the existing Python program. I started by looking through the different functions and classes within the code and matching them to their corresponding sections in the paper. On Wednesday we had a video chat with the creator to learn more about how the Python program works. After this, I was able to run short tests provided in the code which allowed me to see examples of best response dynamics in action. I also started to read the probability notes Anna suggested; I read note 12 this week.
I attended the theory seminar talk on Tuesday and the theory lunch talk on Friday which were both about "Alternate minimization algorithms for (matrix, operator, tensor) scaling problems, and their analysis" given by Rafael Oliveira, a postdoc at the University of Toronto.
On Friday after work I went to PoCSci 2018. It is the CSE's annual conference which consists of funny talks. For example, one talk discussed how CPUs are like penguins and another talk was filled with computer science and engineering cat puns.
On Monday we had another video chat to learn about the plotting section of the Python program. After the chat, I tested out the different plots to get a better grasp on how they work. This week I began incorporating production costs for the sellers into the code. I ran short tests to make sure the different distributions and mechanisms worked with the new code. I also worked on fixing a small bug in the code; there were cases where the code did not detect when the search cost was too high. To solidify my understanding of the code and how it all works together, I started creating a call tree. I continued reading probability notes as well (note 13 and note 14).
On Tuesday I attended Cyrus Rashtchian's thesis defense entitled "New Algorithmic Tools for Distributed Similarity Search and Edge Estimation." On Friday I went to the theory lunch talk on "Wasserstein GAN" given by Sudipto Mukherjee, a UW graduate student.
I read more probability notes this week (note 15, note 16, and note 17). A plotting problem arose when I used different production costs for the sellers; I worked on fixing this error. I had a video chat on Thursday to get advice on how to do this. Throughout the week I also worked on adding a distribution option for each seller. To test my changes, I used the same distribution for both sellers and compared my results to the ones I had done in week 1. I also started writing new demand functions for the sellers that are easier to read. I am still trying to figure out why they are not giving the same results as the old demand functions.
I was able to get my new demand functions to give the same results as the old ones. After fixing the plotting problem, I tried recreating the plots in the paper by setting both production costs to zero. I also tried recreating the plots in the paper by using the original code. Both codes gave me the same results, and these results were slightly different from the ones in the paper. I'm not sure why this is happening. I did more experiments with my newest code; I created other sets of plots using two different production costs. I also continued working on adding a distribution for both sellers. The probability notes I read this week were note 18 and note 19.
I finished adding a second distribution option into the code. I created a set of plots using different distributions (uniform random and geometric) and kept the seller production costs at zero. To keep things more balanced, when using two different distributions I selected parameters so that the two distributions had the same expected value. I also added new output plots to show the change in seller revenue and equilibrium price when two different production costs or distributions are used. I started a document that contains the graphs I have created and my comments about them. This week I read probability note 20.
My newest code from last week assumes that there are two sellers. So, this week I began working on designing code that would allow for an arbitrary number of sellers. First, I started with an empty Python script and worked on creating a seller class so that any number of sellers can be used in the code. After this, my approach was to slowly add some portions of last week's code into my new script but change the classes and functions so that they would work for any number of sellers. I also continued adding comments to the document I made last week. I read probability note 24 this week.
On Wednesday I attended the first talk of an undergraduate summer lunch series. The talk was given by Sidd Srinivasa, a UW professor, and it was about "Making the most out of your summer research experience."
During the week I continued working on the code for any number of sellers. I wrote new code to calculate buyer utility and demand. This has been the most difficult coding problem for me. When there were only two sellers, there were two for-loops used and special conditions that would set off the second for-loop. I have had to make a lot of new changes to calculate the values for an unknown number of sellers. I compared the answers from my two seller code and my new code. I also wrote the buyer utility and demand for exactly four sellers to use to check my calculations for the new code. I am still working on figuring out why my answers are not matching up.
This week I continued revising my codes that use more than two sellers. I did more tests to determine if they were producing the correct calculations. As another way to check my codes I made my four seller code work for two sellers by commenting out the third and fourth seller. I compared this to my two seller code and the demand answers were not the same but the buyer utility was. There were some minor case differences between the codes of when demand was allowed to be added. Based on the tests I have done, it seems like I have fixed my codes so that they all give the same answers now. I also added in the best response dynamics for the four seller code and the code for any number of sellers.
On Wednesday I went to the second talk in the undergraduate summer lunch series. UW graduate students from various areas gave short talks about the kinds of research their group works on.
I created two new plots for my two seller code. One plot shows the demand for the non buy box and the other shows the probability that the non buy box is opened by the buyer. I ran more experiments for two sellers using a larger difference in production cost. I also worked on adding the rest of the functions to my four seller code so that it now has plotting capabilities. Using a large support of 100 integers or more for the distributions takes too long so I tested my additions using a very small support. To help determine the size of experiments that are feasible, I included a time estimation for how long a best response takes. After I finished writing my four seller code, I copied it to create a three seller code.
On Friday I went to the theory lunch talk on "Clarkson's Algorithm" given by Thomas Rothvoss, a UW professor.
This week I ran a couple of experiments for three sellers to add to my document. I made some small changes to my code so it would run faster. Instead of having a function that determines which demand should be updated, I added if-statements to decide which seller the buyer would choose. I also separated one of my functions so that buyer utility and demand are computed separately to save time on unneeded calculations. I created more plots for the three seller code to show all three seller's equilibrium price/seller revenue for each mechanism on separate plots. I worked on wrapping up my contributions to the project and writing more results of my experiments.
On Wednesday I attended my last talk for the summer. This talk was the third one of the undergraduate summer lunch series. It consisted of a panel of four graduate students who answered questions and discussed their lives as PhD students.