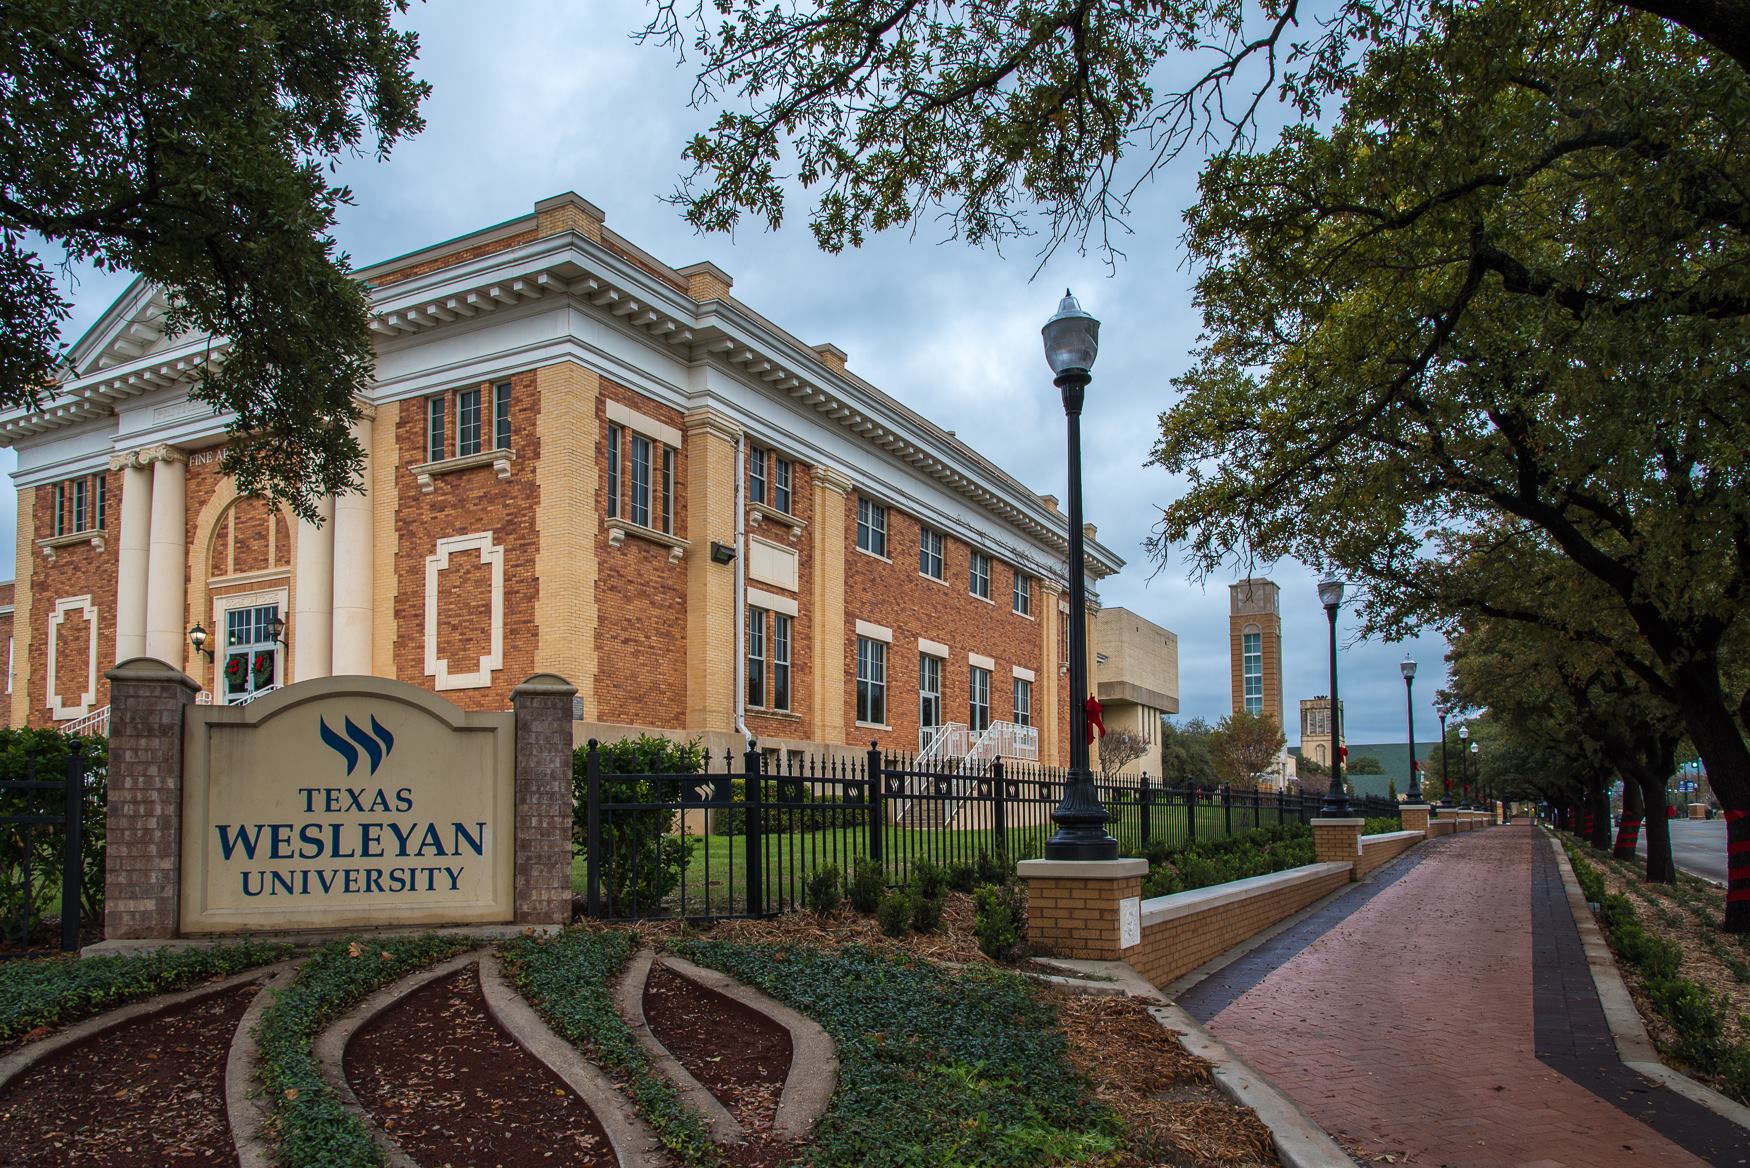
I am a junior undergraduate Computer Science major at Texas Wesleyan University expecting to graduate with my math minor and BS in the Fall of 2019. Previously at my home university I did research on Mathematical approximation and modeling of Electric Potential with Poisson's Equation under Dr. Yukong Zhang. I am currently doing research in TAMU Parasol Lab under Dr.Amato through the CRA-W DREU program.
My mentor is Mukulika Ghosh and our research is on Workspace Skeleton features for a visualization tool, vizmo++. There are many limitation faced within the field of motion planing. The foremost is that we live in a 3 dimensional world, so it hard for us to visualize beyond that. Fortunately there are computers which we are able to program to solve algorithms with high degrees of freedom. Our goals is to add features to the vizmo software which would increase the efficiency of vizmo. Even though the workspace is confined to a 3D space we hope to increase the amount of information we can get from it.
My personal website: 2017 CRA-W DREU Personal Website
My Mentors:
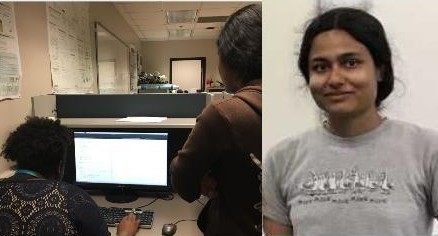
Under Dr. Nancy Amato me and my mentor Mukulika Ghosh
a Computer Science PhD student at TAMU, are working in TAMU Parasol Lab. Mukulika and I are researching Workspace Skeleton visualization tools.
Click the "Photos" button to toggle between hiding and showing the Photos:
I will be using C++ to add an overlay called a skeleton which will help visualize and understand more realistically the accepted paths and accessibility of a passage through which a path exists. The skeleton is a sort of specialized axis on which we hope the path is optimally safe and convenient. The way we represent this skeleton is with the Graph data structure made up of edges and vertices. We hope to develop a manipulable structure which can optimize the efficiency of our Motion Planing Problem Solver.
Motion Planning
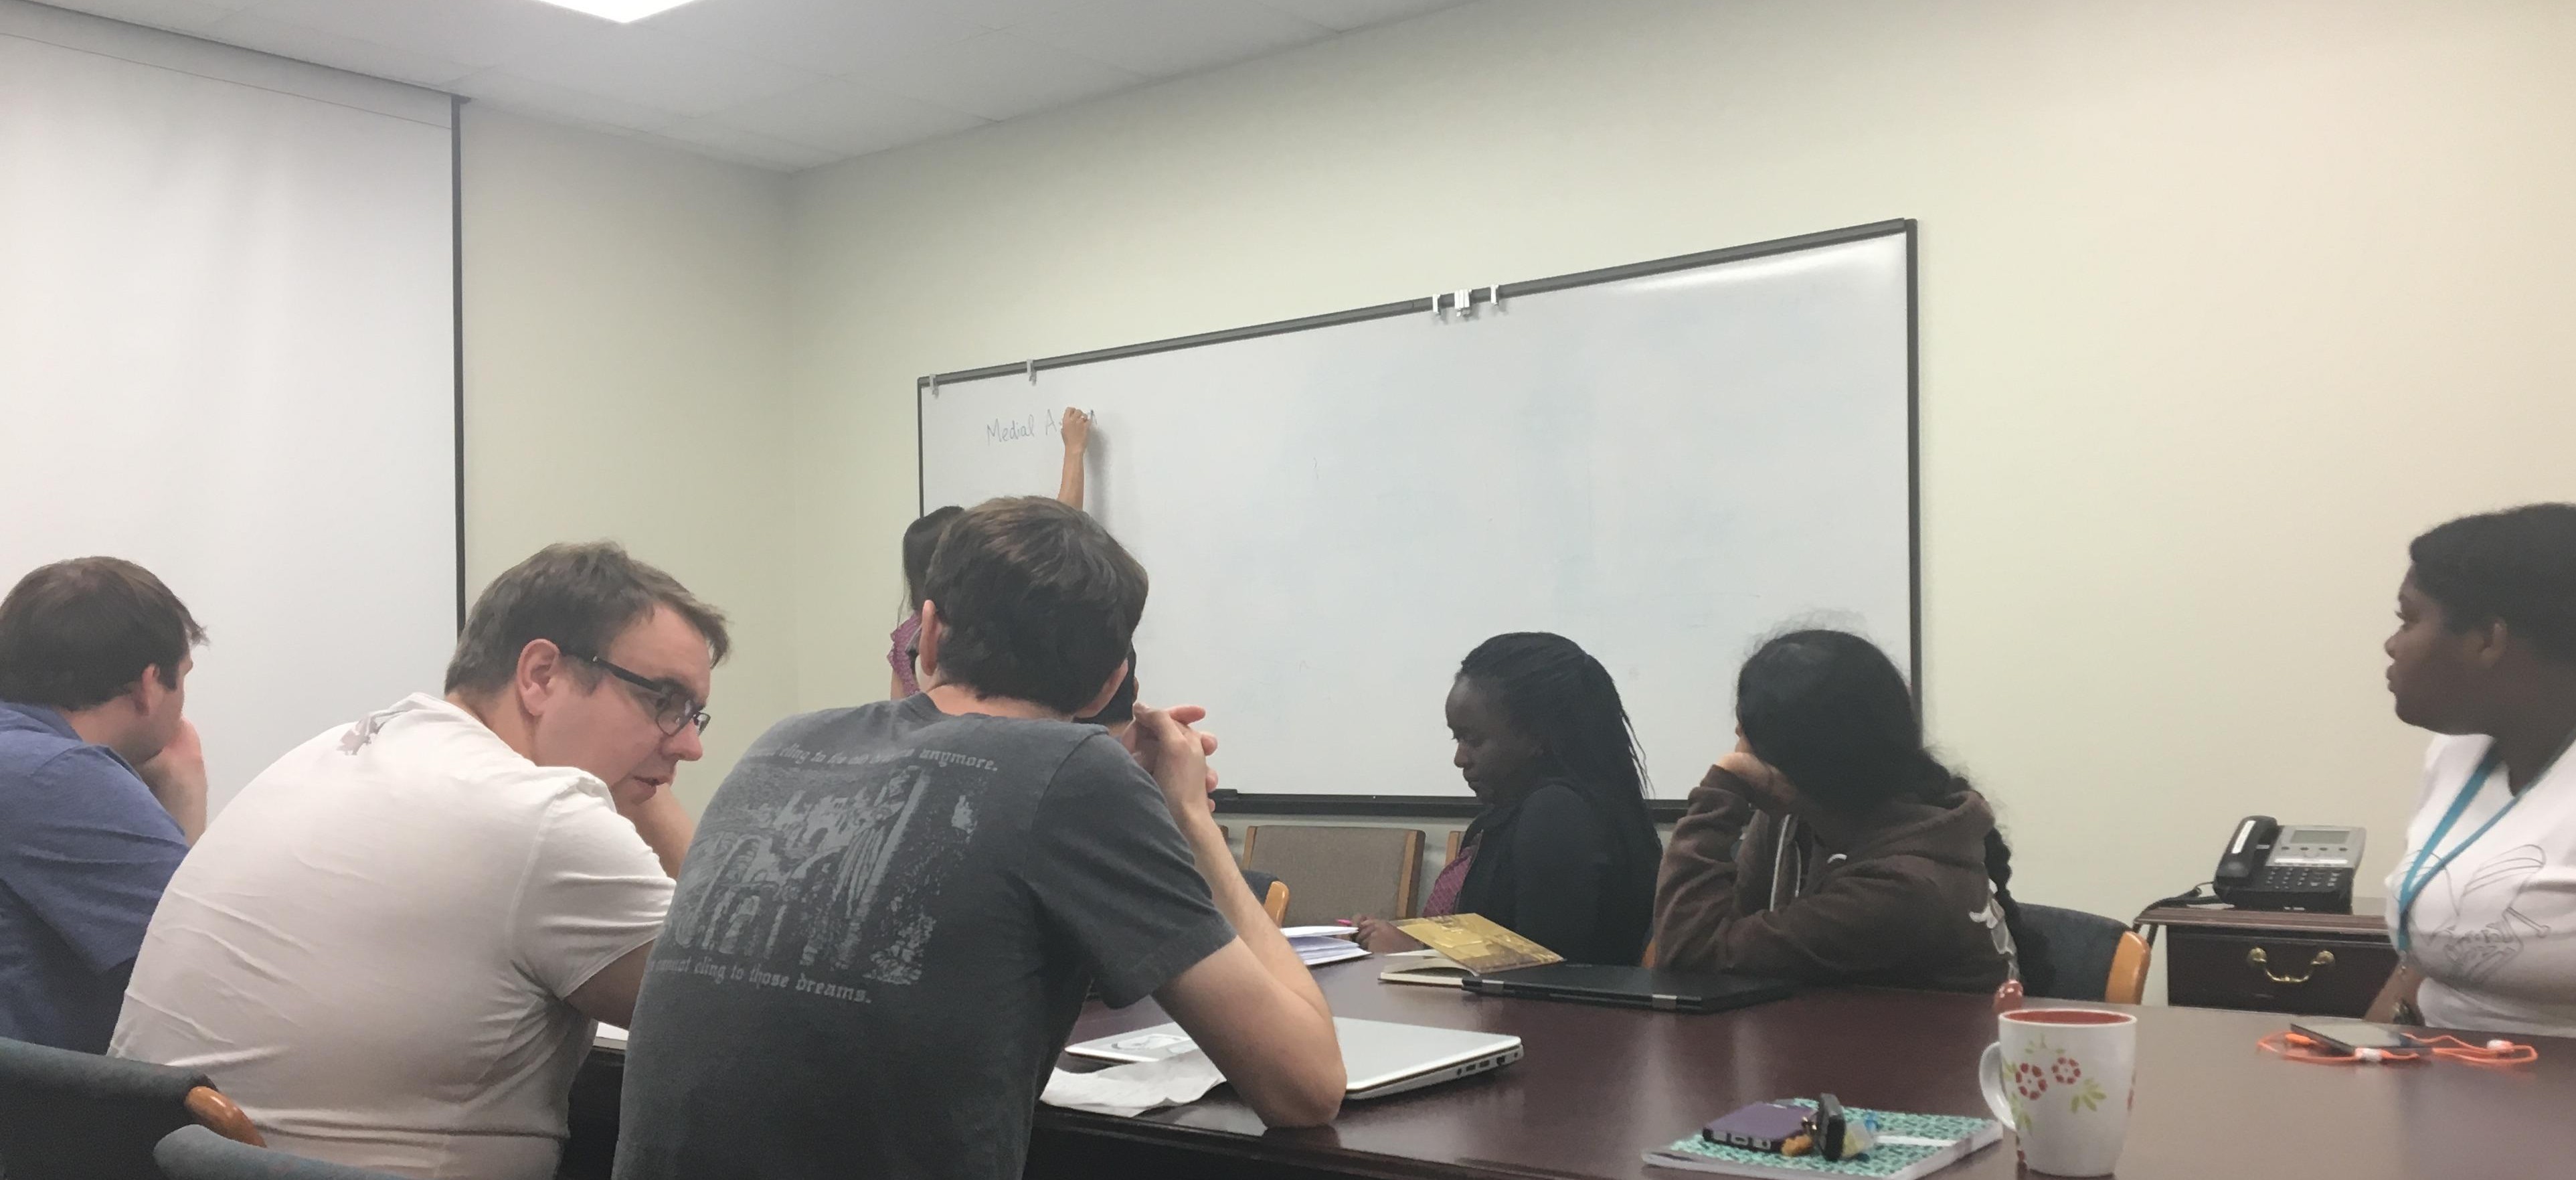
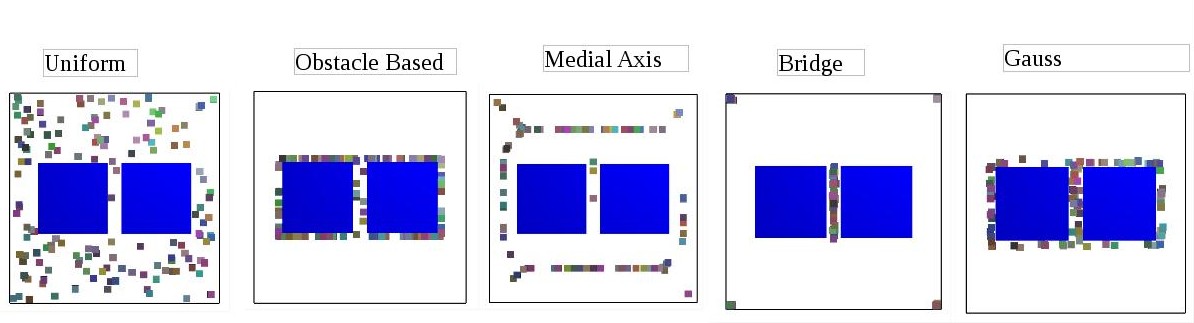
For a motion planning simulation we need a several tool with specific jobs to construct a Probabilistic Roadmap(PRM). The first steps are theDistance Metric, Validity Checker, and Sampler the picture shows several different sampling methods. The first sampling method is Uniform where it randomly selects a spot in the Configuration space if it is valid or not in collision then we keep the coordinates.
The Obstacle Based Sampler is
The Medial AxisSampler randomly generates coordinates and is basically pushed on to the nearest location on the medial axis, the good thing about this is that even if a point is invalid you can still use it by relocating it. The process is longer than just picking another random point but it is a good solution because it is immediate in that the next point is certainly valid. Also it provides maximum distance from obstacles which is safer.
The Bridge Sampler is
The Gauss Sampler seems very complex to me. Each configuration has a radius and each new configuration depends on the last.
Neighborhood Finders
determine the nearest neighbors within a roadmap.
Local Planners
determine paths between configurations.
Extenders
step configurations toward a direction until an end condition.
Connectors
Generate edges of a roadmap.
Metrics
determine a value/ property from a road map.
Map Evaluators
determine if a roadmap passes an evaluation test.
Path Modifiers, Decomposition Region, and Motion Planning Strategies
are all to optimize the query solving process.
Purpose
Motion Planning is very useful and it is applicable to many real world problems. The more detailed the system is the safer and more efficient the path is. Our purpose is the enhance motion planing capabilities by adding more details to our display so that we can solve more complex problems. Currently we usually use and abstract C-space to develop a path which does not easily allow users to visualize complexity. Also our work space is limited to at most 3 dimensional environments, however robots may have many more degrees of freedom. With the skeleton display we will be able to add more depth to our visualization, so while we can go beyond 3D we can view properties which may affect a paths accessibility.
Week 1: May 30 - June 3
This week I completed sections 1 and 2 of the crash course outlining
the basis of Motion Planning. I have been testing and observing sampling methods and viewing the maps and path constructions as well as statistics.Next week I will begin learning how to check in code.
Recipe of the Week
I don't know what to put here
Chicken Tetrazzini! Chicken Breast, Cream of Mushroom, Cream of Chicken, Sour Cream , Mixed Veggies, Parmesan, Spaghetti
First
Week 2: June 5 - June 9
I have progressed to exploring the code we will be be revising in order to create the overlay.
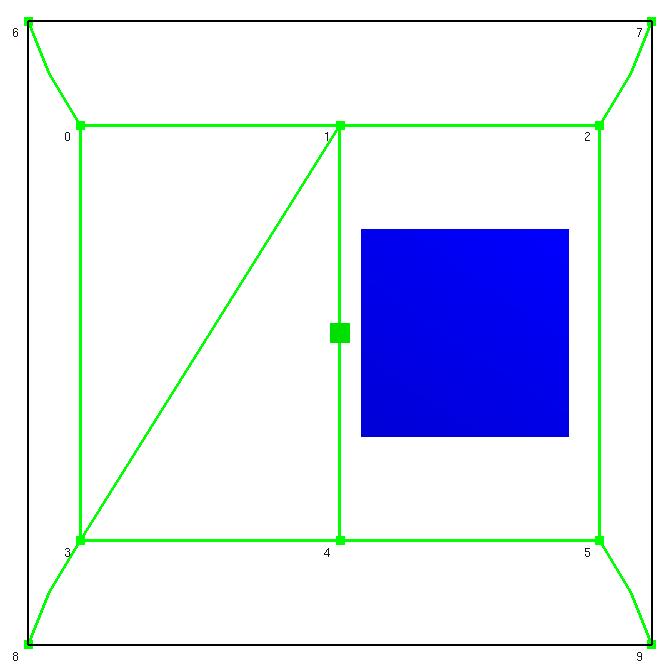
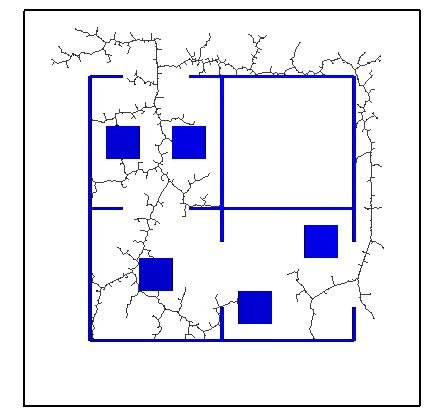
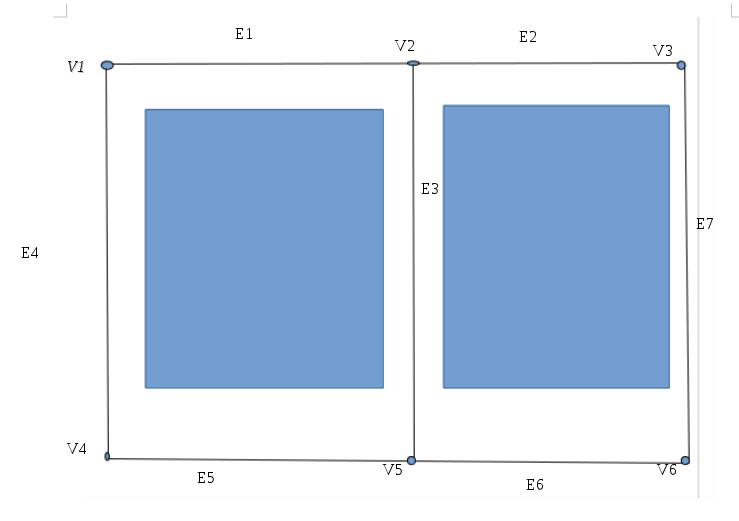
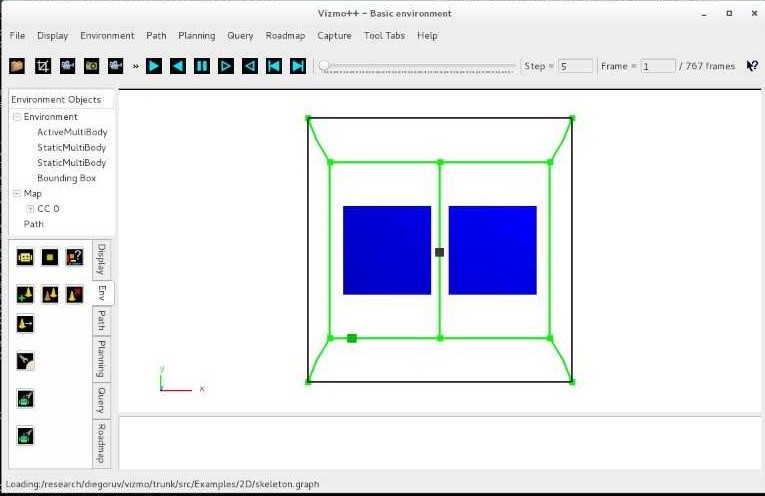
This image depicts a version of the end product we hope to produce.
Each point where on line meets another is called a vertex labeled V#.
Each line connecting the vertices are called edges.
We would like to associate each vertex and edge with specific properties which would describe the environment clearly enough so that the user may manipulate our skeleton to optimize accessibility through the environment and around obstacles.
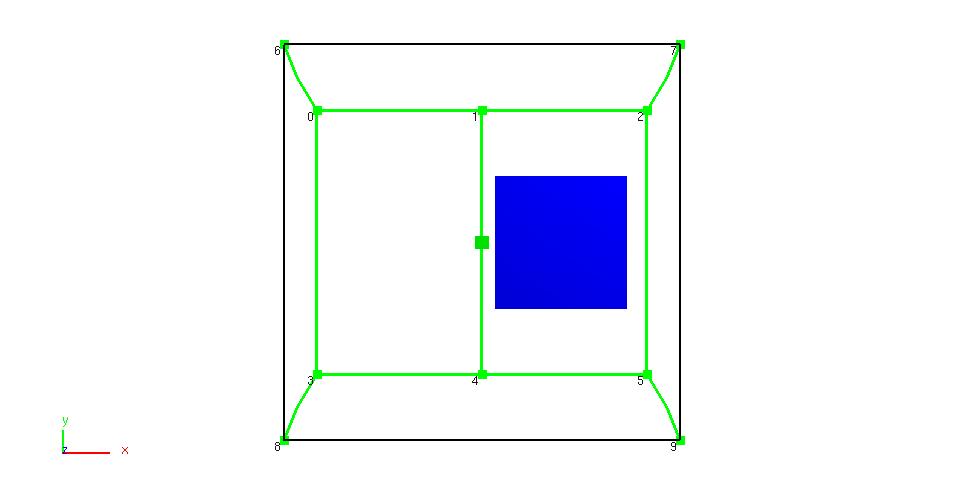
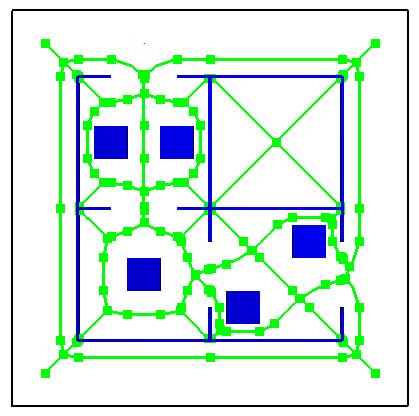
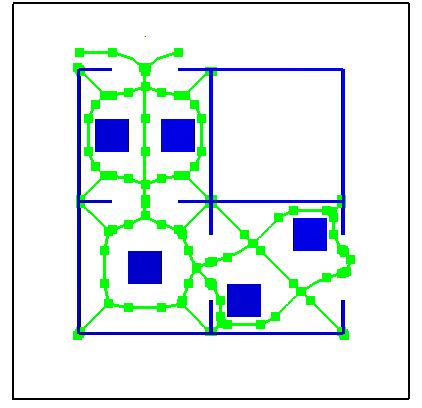
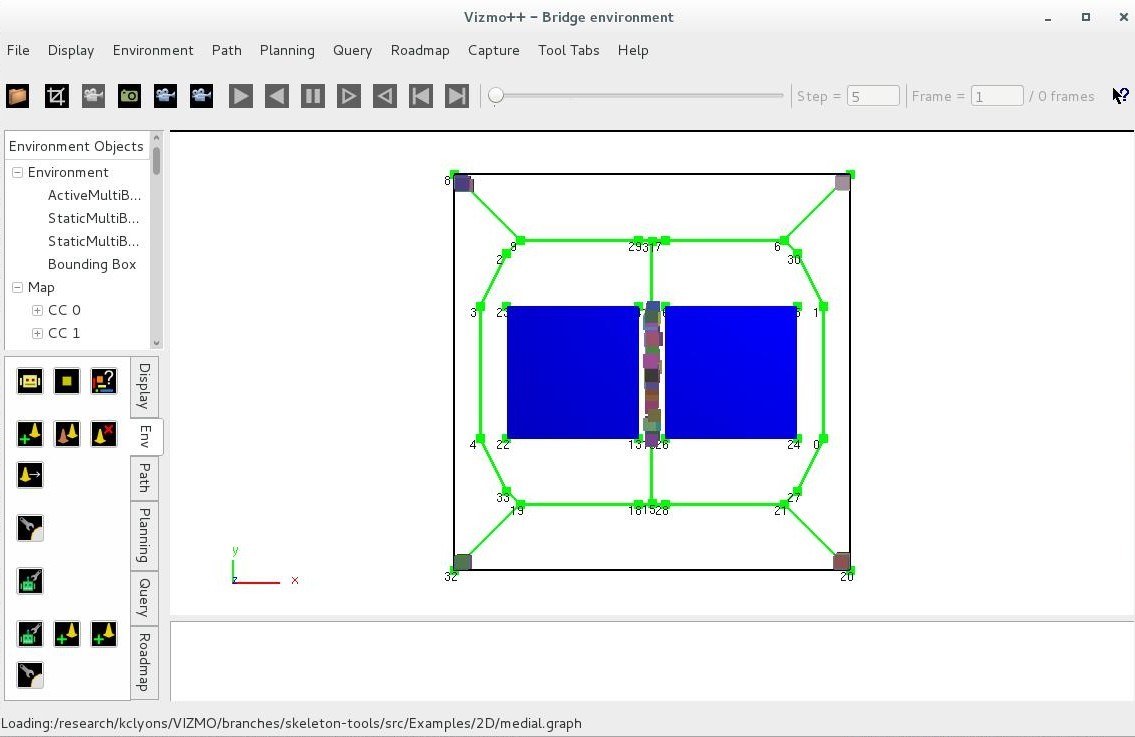
This is a picture of the Medial Axis Skeleton overlay.
First we coded a new button from which we could select a graph file from.
We extracted the number of vertices and edge, then we associated an x, y, and z coordinate with each vertex.
Lastly we associated each edge, which is represented by a vector of points, with appropriate point values used to connect the vertices.
Recipe of the Week
I don't know what to put here
Chili Pinto Beans, Diced Tomatoes, Corn, Potatoes, Ground Beef, Chili Mix
First cook the meat, once it is done pour off the grease. Add the beans, diced tomatoes, potatoes, corn, and chili mix to the pot and let it cook covered on medium heat, stir occasionally, and chili mix to the pot and let it cook covered on medium heat, stir occasionally. Once the potatoes are done the meal is ready. You can eat it by its self or over rice.
Week 3: June 11 - June 15
We have successfully added a save button to our vizmo visualization tool. The button will save the graph but our main dilemma is that the graph does not allow us to make changes like delete and add a vertex or edge. We made a Property Map class which we want to allow us to display properties of each individual edge and vertex. At the moment we have the skeleton graph structure saved as a whole collection of vertices and edges. We think it may be a problem that each vertex and edge is not an object with its own characteristics, this may mean that we have to rewrite the Save function.
Recipe of the Week
I don't know what to put here
Cabbage Bacon, Smoked Sausage, Cabbage
First cook the bacon once it's done I take out the bacon because I don't like soggy bacon. Then I cut the sausage up into thin circles and fry them in the bacon grease. Next wash the cabbage and put it into the pot and cook it covered in medium heat.
Week 4: June 19 - June 23
This week we were able to display the descriptors for each vertex on the graph, but we are still unable to select or edit the graph.
Next week we will continue trying to find a data type which will enable us to utilize the functions needed to manipulate our graph.
Homemade Mac And Cheese! Macaroni, Sharp Cheddar, Egg, Butter, Milk, Flour
First cook the macaroni and heat the milk on low and then add the butter and cheese. Stir it until the cheese melts into a nice sauce. Then add the egg and a tbsp of flour to make it thick. Put the cooked macaroni into a baking pan and pour the cheese sauce over it sprinkle more cheese on top of it and the put it into the oven on 350 degrees until the top gets melted and golden.
Week 5: June 26 - June 30
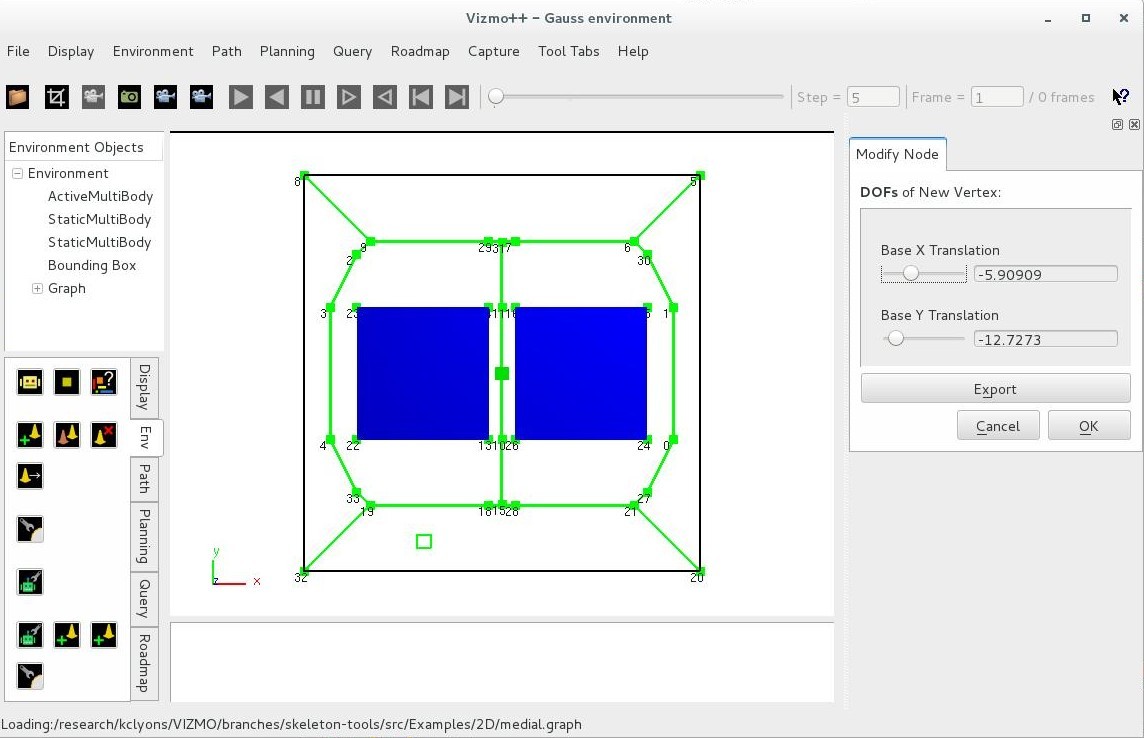
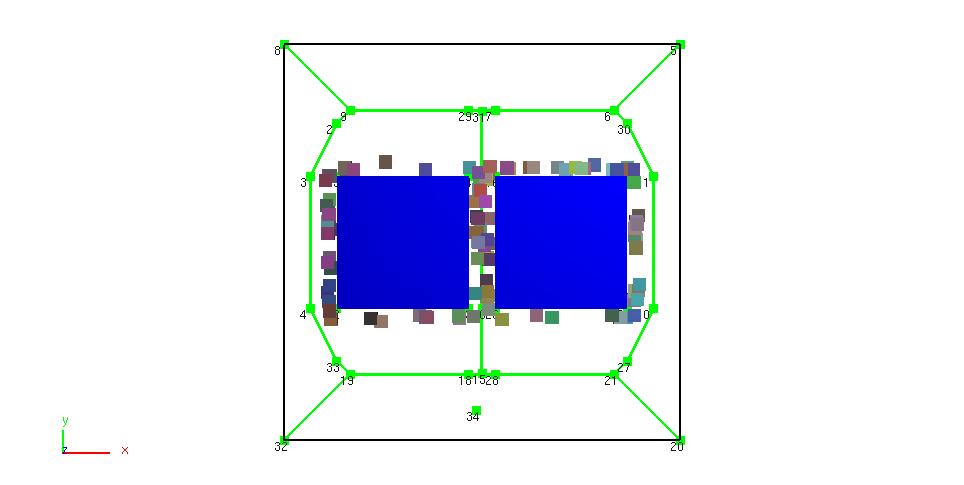
This week we have been working on adding a vertex to the graph. We enabled the button to display a window wherein we can specify coordinates to place the vertex. And now we can actually add a vertex to our graph structure. In the picture below I added vertex 34 to the graph. Next we will begin working on how to delete a vertex from the graph it graph.
BEFORE:
Enabled Vertex Placement sliding bar:
AFTER: Added vertex 34 to graph
Week 6: July 3 - July 7
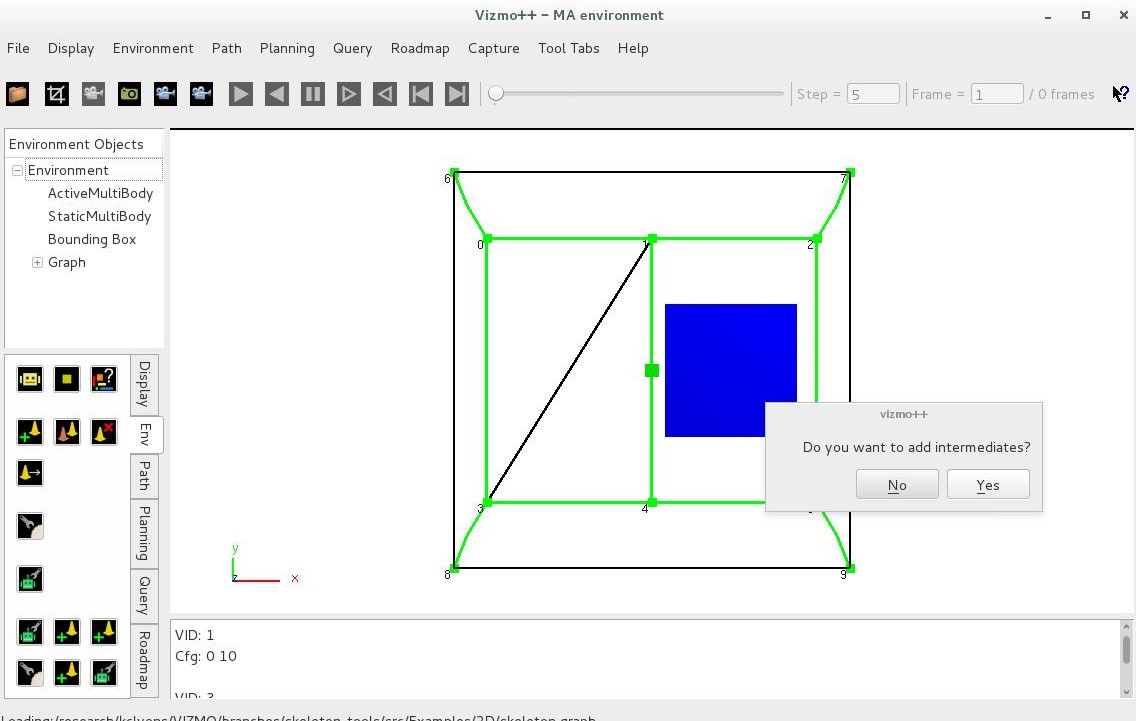
This week we worked on enabling a button which allow the user to add an edge to the graph. The next thing we need to work on is adding intermediates, merging edges and changing the color of selected graph components.
Week 7: July 10 - July 14
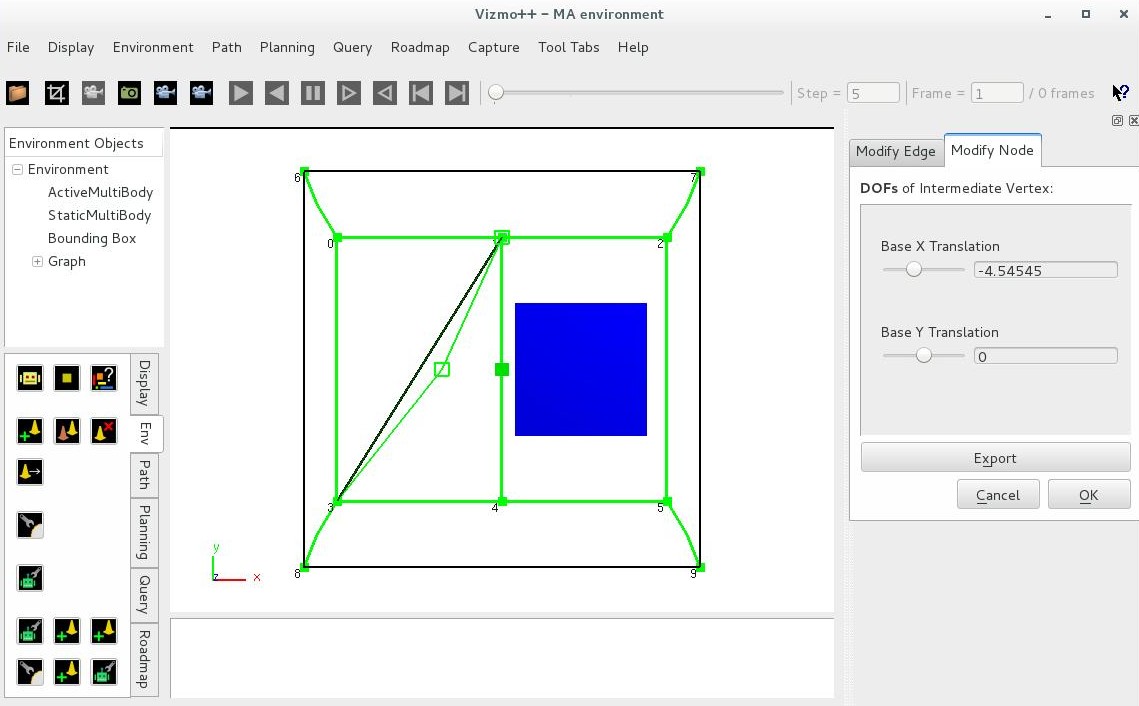
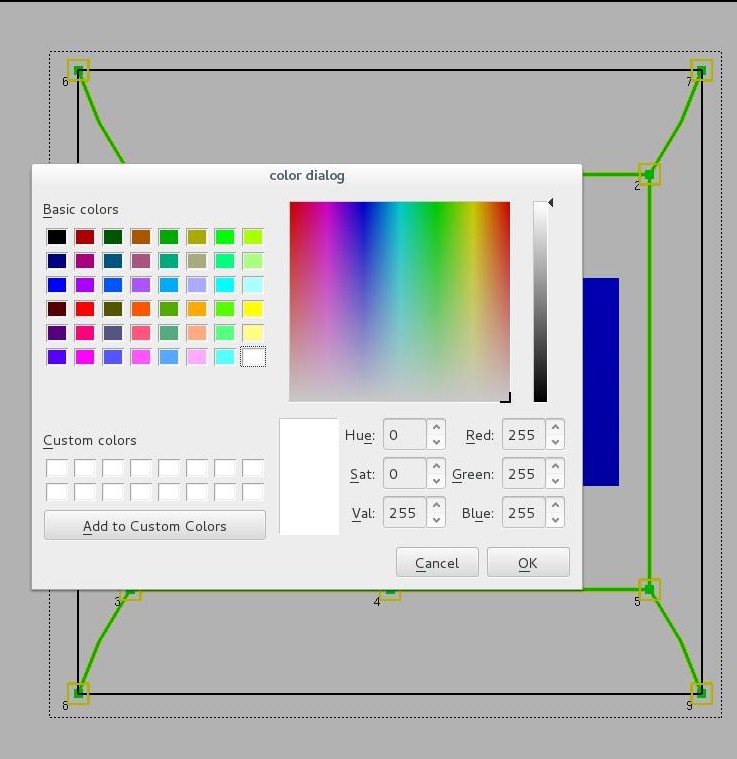
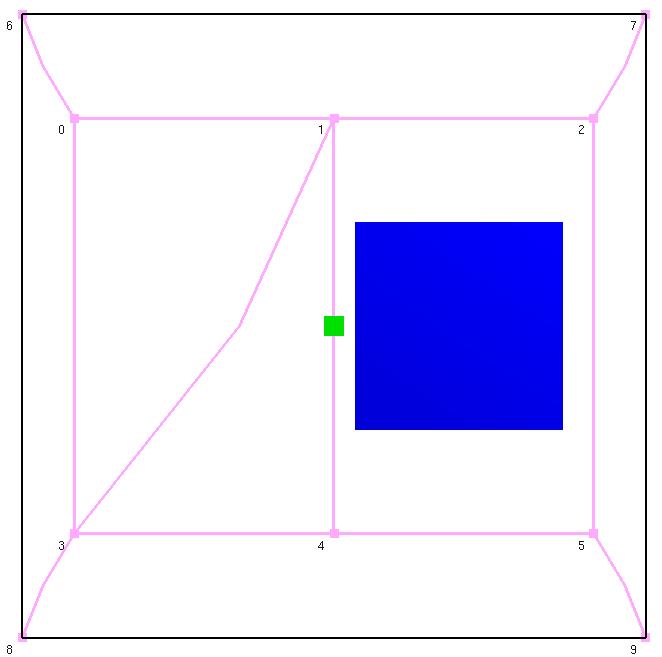
We made our add edge button allow users to select intermediates which would give the edge curvature and enabled a button which allows the user to change the color of the graph components. We also started working on our poster for our project. Next week will present our posters on Monday after that we will start working on the merge Edge button.
Adding an edge and intermediates
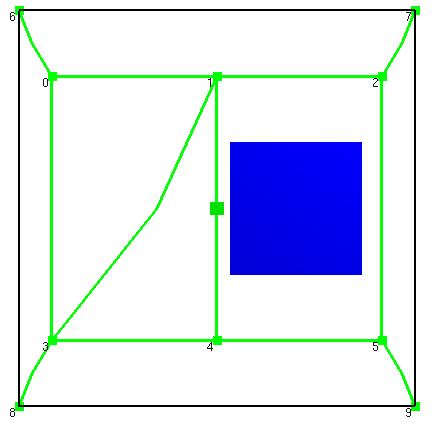
Changing the color of the graph
Week 8: June 17 - July 21
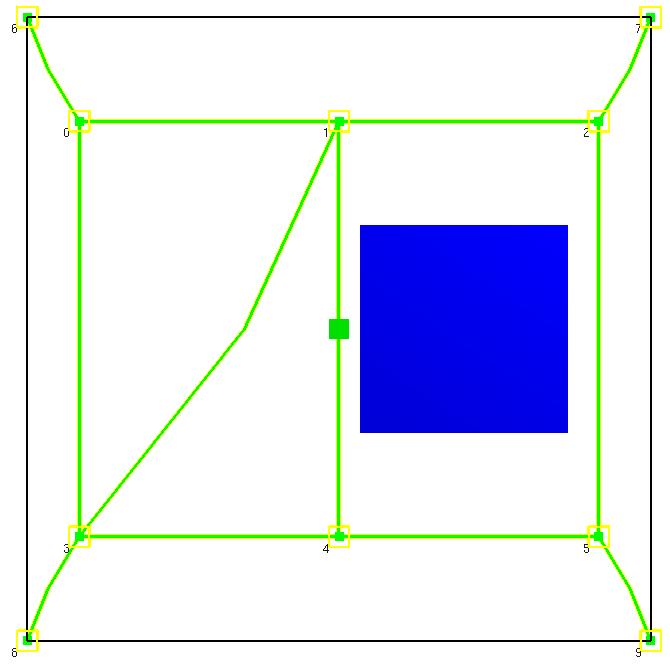
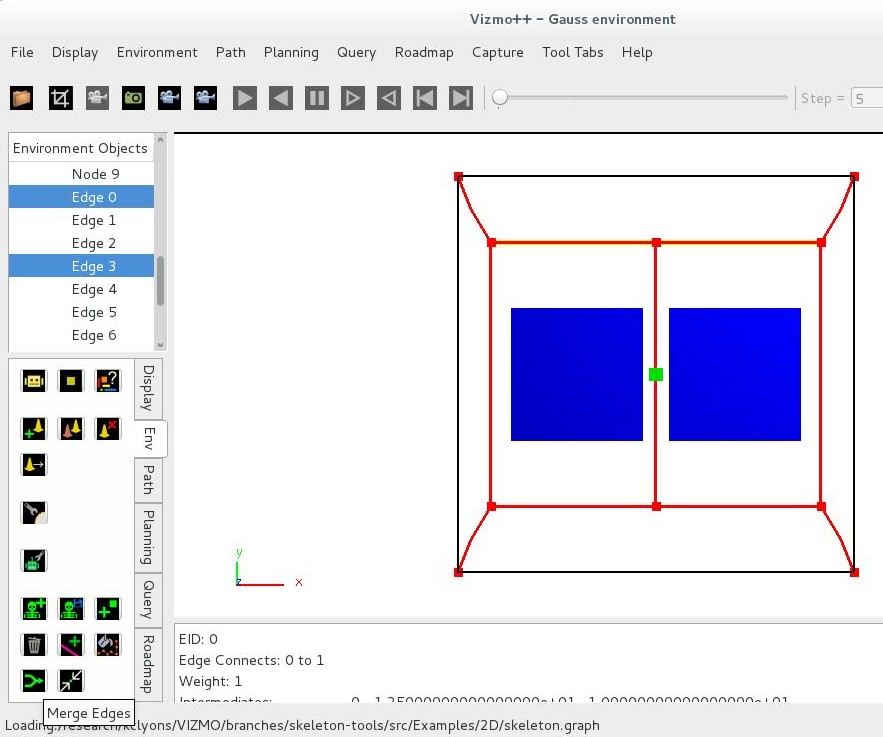
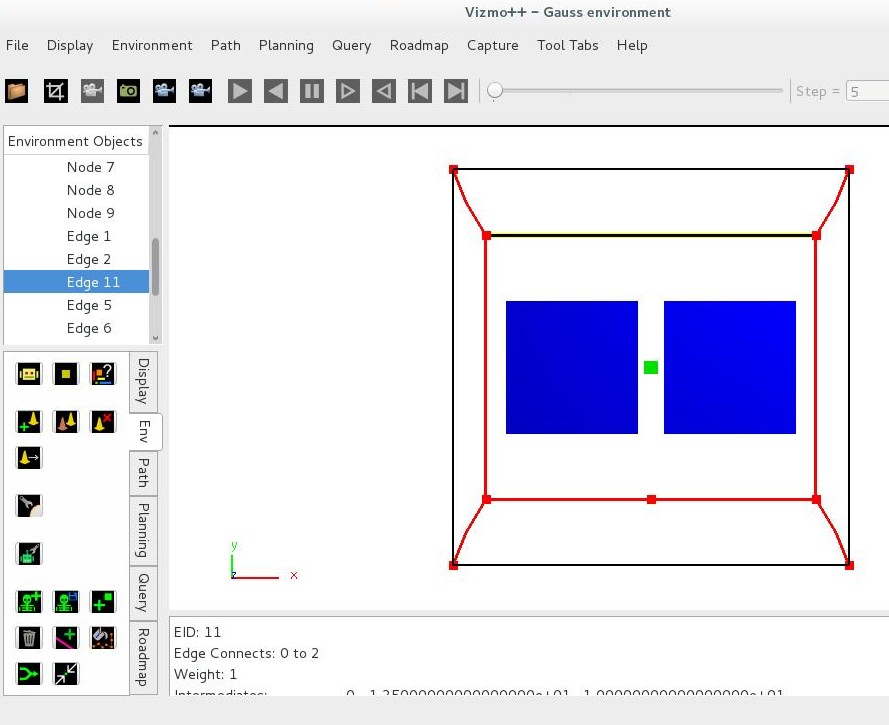
This week we finished making icons for our new button and we made our merge edges button work. We began working on our collapse edge button functionality. Next week we will continue working on the collapse edge function. We will also continue to add to our poster and our report.
I selected Edges 0 and 3 to merge in the second picture edges 0 and 3 are merged forming edge 11 and Edges 0 and 3 are no longer on the Graph List
Week 9: June 24 - June 28
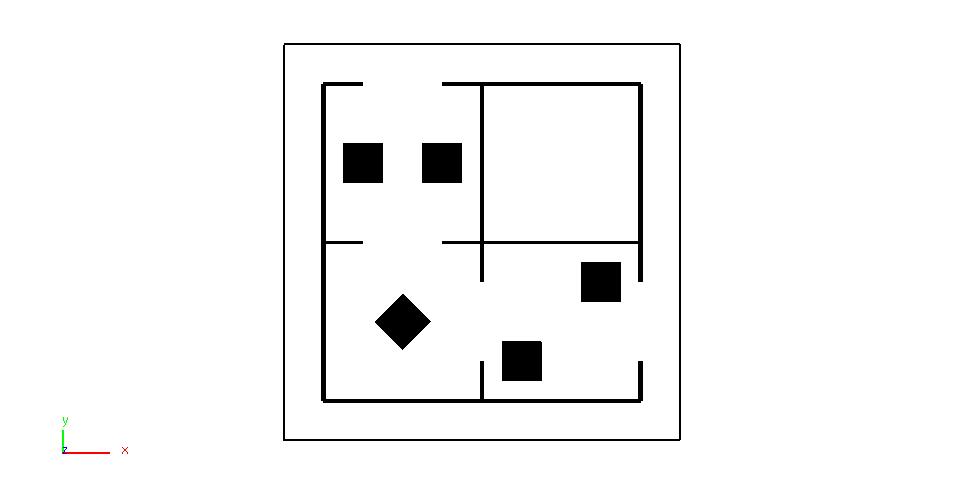
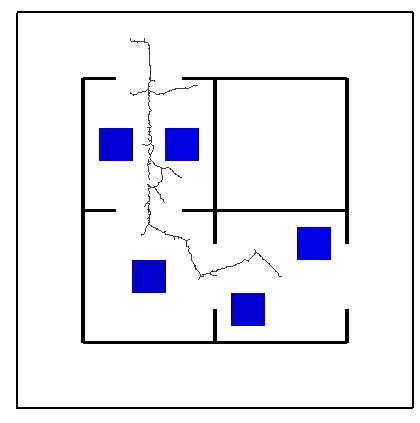
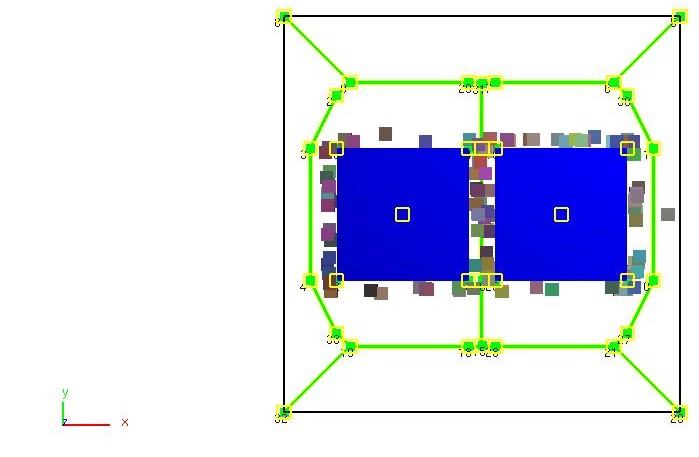
We are now beginning to set up our experiments to see how a motion planning strategy based on the workspace skeleton will solve a query. We have designed a workspace to test the query solving capabilities of our new motion planning strategy.
 I am a junior undergraduate Computer Science major at Texas Wesleyan University expecting to graduate with my math minor and BS in the Fall of 2019. Previously at my home university I did research on Mathematical approximation and modeling of Electric Potential with Poisson's Equation under Dr. Yukong Zhang. I am currently doing research in TAMU Parasol Lab under Dr.Amato through the CRA-W DREU program.
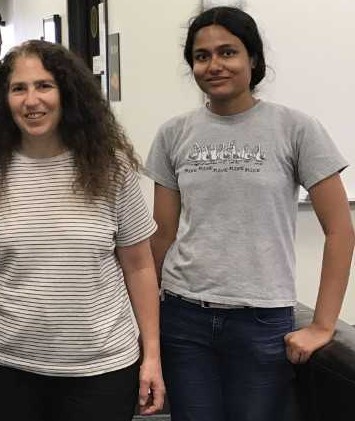


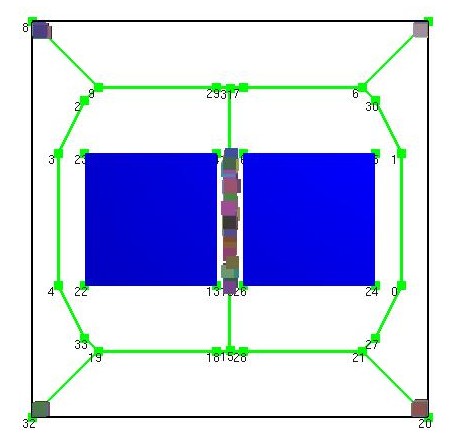

 Displays vertex descriptors
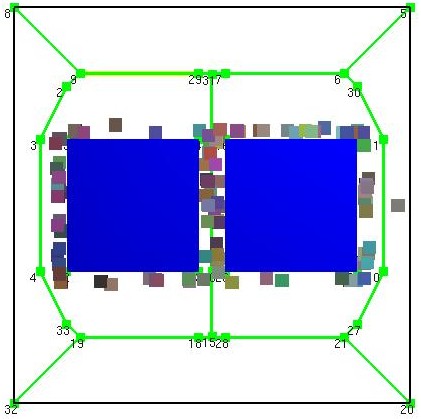 Highlights edge connecting vertex 9 and 29
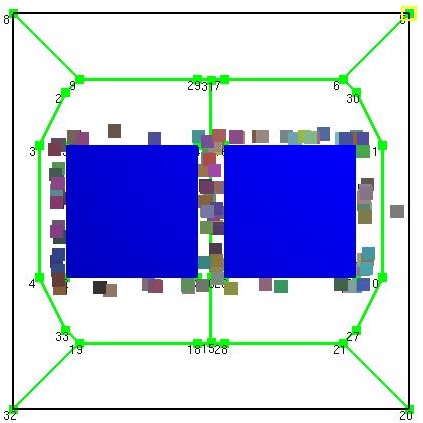 Highlights vertex 5