Distributed Mentoring Program

Project
Web Journal
About Me
About My Mentor
Final Report


Main Menu

Project Description


Seven League Boots and Directed Flying: An Investigation of Navigation Modes in Large Virtual Environments

I am working on a project designed to test the effectiveness of certain modes of navigation through a virtual environment presented to test subjects through a head mounted display. We are examining two modes of navigation, "seven league boots" and "directed flying," and attempting to determine whether the idiothetic cues (information provided through muscule movement) inherent in seven league boots help subjects to perform better in tasks requiring accurate spacial orientation than those only receiving the visual information from navigation using a joystick.


Main Menu
Web Journal


Week 1: June 26 - July 2


So, I have made it through my first week at the University of Minnesota! My mentor Vicki has been at a conference in Italy all week, so I'm not going to be able to meet her until next week. Luckily, there is another DMP student working in the same lab -- Leanne Gray. So, she has been teaching me about the lab and the different projects that Vicki is working on. We went into the lab on Monday and Leanne and one of Vicki's grad students Jason showed me all their equipment. First of all, there is a GIANT curved screen that covers the far wall of the lab. Another grad student, Brian is doing research on how to correctly display three dimentional models on the curved screen. It is pretty impressive. They also have a head mounted display -- a helmet-like device that has two computer screens inside of it -- which allows a user to walk around in a three dimentional model, or virtual reality. It's all pretty cool. Jason let me walk around in a model of the lab he made that they are using to study vertigo. The virtual model looks just like the lab room except that the floor is cut out, allowing you to look down two more stories. There is a little footbridge that goes across the floor above these two stories. The crazy thing is that when you are walking around in the model, you really feel like you might fall if you step off the bridge. It is incredible. So, I had a lot of fun with that.

Otherwise this week I have just be doing a lot of background work, reading some of Vicki's articles and learning about her research. Towards the end of the week I got an email from another one of Vicki's grad students, Coleman, about a project on color palette preference for multivariate visualizations. He told me that Vicki had suggested he pass the project on to me, since he just graduated and is going to leave soon. So, I started to think about this project as well, and did some background reading about color palette selection. Leanne and I have also been having a Minnesota appreciation week, exploring the area near the University and even making it out to the Mall of America. So, it has been a pretty fun and exciting first week.

Main Menu


Week 2: July 3 - July 9


This week has been pretty short due to the long weekend for the fourth of July. I had a pretty memorable weekend, working with my friend Julia from Colby on the campaign for Team Minnesota (check them out at http://www.teamMN.com/). So, I participated in a number of parades, even braving a sumo suit and "fighting" as either the GOP or the DFL (don't get bogged down in political bickering...vote Independent! Not left, not right, forward -- or at least that's the idea). The parades were fun because I was able to visit a lot of suburbs. I am seeing much more of Minnesota than I ever expected!

Okay, so in terms of work, I met with my mentor Vicki on Thursday for the first time. She told me that I will be working on this color palette preference project as my main focus this summer. It is exciting to have a real project and a focus finally, but I am a little bit disappointed because I am really interested in the projects involving virtual realities. Vicki is very friendly and clearly a great researcher, and I am looking forward to working with her. So, after our meeting, I set off on the color project. The research is based on the theory that a multivariate visualization (in other words an image that displays data in some way) will be more effective and easier to understand if the reader finds the color palette used in the image to be pleasing. Additionally, Vicki and Coleman have hypothesized that the color palettes found in natural images (pictures of nature) may be more pleasing than those generated through various methods on computers. In order to test these theories, Coleman created what we call "noise images" for a number of natural images and multivariate visualization images. Basically, these are images that retain the colors present in the original picture in the correct percentages, but remove the original context of the image to be sure that a test participant is reacting only to the pleasntness of the colors and not the 
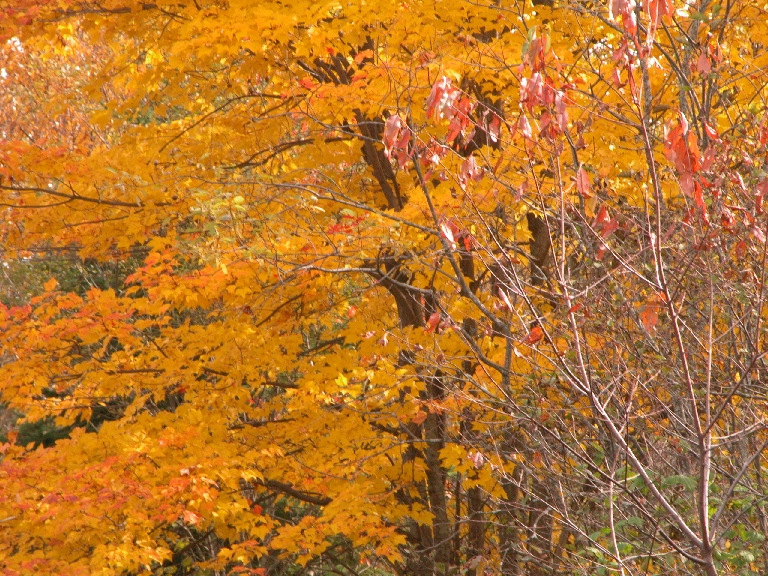
picture they form. Noise images are just a bunch of colored dots -- the background of this website is actually a noise image of a fall foliage scene. Pretty cool! So, in the original study, users were asked to rate 54 of these noise images, half natural have multivariate visualizations, in order of pleasntness. This is how Vicki and Coleman collected their original data.

In our meeting on Thursday, Vicki told me that she presented the color palette research at the Italy conference, and that the main criticism she received was that people wanted her to compare the color palettes of the natural images to the color palettes of the multivariate visualization images with the backgrounds removed. In the original study, Coleman and Vicki had created the multivariate color paletes from the complete multivariate images, including the often dominant white background. This means that the multivariate visualization noise images are often blatantly uglier because they are mainly white with a few specs of color. So my job is to create a whole new set of noise images, both increasing the complete set number to 100 and creating new noise images for all the multivariate visualization images with their backgrounds removed.

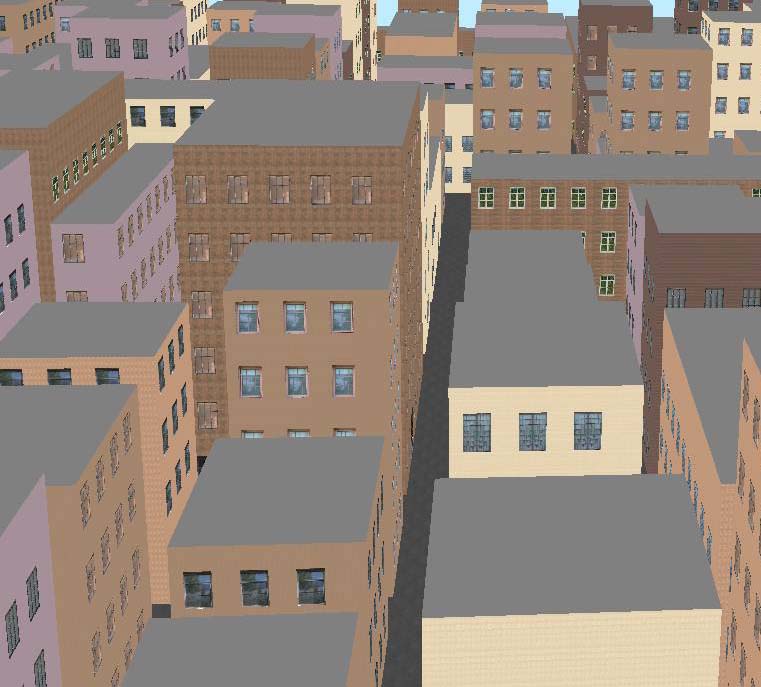
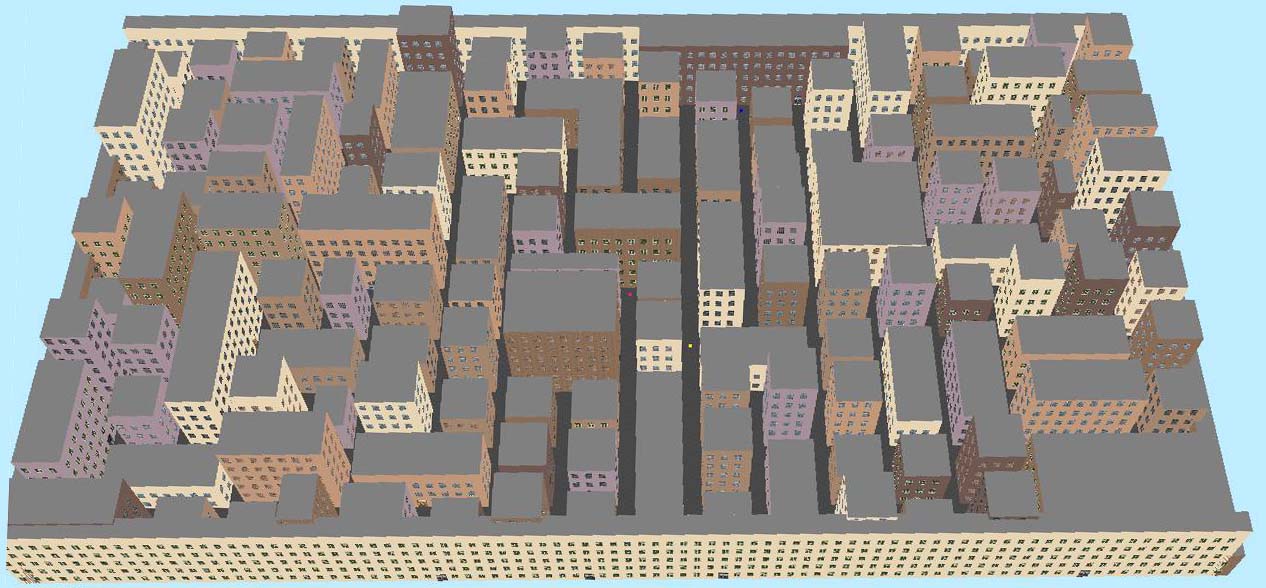
At this same meeting with Vicki, Leanne was asked to build a three-dimensional city model to use with the head mounted display so that Vicki can conduct a user study looking at different methods of navigating through a large virtual environment in a physically small room. Leanne is not the hugest fan of programming, and I really want to learn graphics programming, so I have also been helping her out with her project. Over the weekend we got a very rough version of the city up and running, which was really exciting. Basically it is just 100 huge colored boxes at the moment, but it is still cool to be able to draw a city plan on paper and then walk around in it with the head mounted display just a few days later. So much fun!

Main Menu


Week 3: July 10 - July 16


This week I worked on coming up with criteria to choose the natural and multivariate images to be included in the new study. This is difficult because I have to, for example, select natural images completely randomly so as not to introduce any bias but still weed out those in the McGill Colour Database that have people or human-made objects in them. The McGill Colour Database is our source for natural images. So, first of all I wrote a random number generator that outputs a random number between any x and y entered in as parameters. Afterwards, I used this to select the page and the image number to choose a picture from, and weeded out any that included visibile human influence. While I was doing this, Leanne was helping me by removing the backgrounds from all of the images in the 2005 Vis papers that we are using as a source for multivariate visualizaiton images. This week we have been pretty much co-working on the two projects. It is really nice to be able to think out loud with someone, so this system has been working well for both of us. So, now I have all of my natural images chosen, but I have not yet weeded through the Vis images or come up with criteria for how to choose which ones should be included in the study. It is kind of difficult because some of the images only have one or two colors, so it would not be very interesting to study their color palettes, but it is difficult to simply not include them without introducing bias. So this is gong to be a problem for me to tackle next week. Otherwise, all I have to do is create the noise images and I will be all set.

Leanne and I have been working like crazy on the city model this week. Next week is Leanne's last week, and she needs to finish the model before she leaves. It has been a pretty funny programming experience because I have never been taught C or C++, so my specialty is in Java and object-oriented design. Leanne has a lot of experience programming in C, but doesn't know much about objects. So, we are trying to combine our knowledge to create a good object-oriented C++ program. We have struggled through a lot of things, the worst being windows and doors. After writing a functioning program that could draw a whole bunch of plain brick buildings, we realized that in order to add windows and doors we were going to need to completely re-write our code so that it separated different data out into building, wall, window, and door objects. The problem was that we needed to calculate the positions of all of the windows and doors at the beginning of the program, store this information somewhere (in an object) and then simply draw the correct planes. so, that caused a difficult couple of days, but we have just gotten everything to work so now we have a fully functioning city that has a bunch of brick buildings with windows and doors! A very satisfying outcome. so, now Leanne is just going to put on a few finishing touches, and I should be able to focus much more on the color palette project next week.

Main Menu


Week 4: July 17 - July 23


This week was Leanne's last full week of work. We met with Vicki on Tuesday to talk about how the projects are going. It seems pretty clear at this point that while Leanne will probably be able to have the city model completely functioning, there will not be time to design and run any experiments before she has to leave. So, since I have been working on the project so much I asked Vicki if it would be possible for me to take over the project when Leanne leaves. I am really enjoying this work, and I am much more interested in graphics than perception (which is what the color project focuses on). Also, I know how all of the code works so it would be much easier for me to take over the project than for a new student to start on it from scratch. Vicki agreed that this would be a good idea, especially since there is still so much work to be done on this project. So that is really exciting!

For the rest of the week, Leanne and I worked on finishing up the city model, and started putting "targets" into the model. These are basically just colored cubes that are hidden on different streets in the model. Vicki thinks that the experiment should involve test subjects navigating to a certain number of targets in the city model. This way we can look at whether they have an easier time navigating using a joystick or seven league boots, which is the question we want to answer. Really we didn't have time to make much headway with the targets, but we started thinking a little bit about the design of the experiment. So, to give you an idea, here are some pictures of the final city model:

So, in other exciting news this week, my 21st birthday was on the 23! Woohoo. So there were also some fun Minneapolis birthday times this weekend. By boyfriend Alex came out to visit for the weekend, and we puttsed around town and saw some of the sights, mainly uptown, which is a pretty cool area. It was also Leanne's last weekend in Minnesota, so we got to celebrate both her goodbye and my birthday! Fun times.

Main Menu


Week 5: July 24 - July 30


This has been an absoluetly crazy and amazing week. It all started with our weekly meeting with Vicki on Tuesday. It was Leanne's last day in Minnesota, so we went out for lunch to celebrate. We were just talking about the project and the summer and all, and Vicki was telling us about SIGGRAPH, the conference she is going to next week. Suddenly she decided that maybe it would be a good idea for me to go to the conference too, since it is a graphics conference and that is my main area of interest. So, luckily I was able to get Travel approval from DMP on really short notice, so before I knew it I was on my way to SIGGRAPH 2006 in Boston! Vicki had also planned on going to another short conference before SIGGRAPH called APGV, Applied Perception in Graphics and Visualization, so I decided to tag along for that conference too, because it seems like they will provide two very different views of the technical conference experience. So, on Friday morning I flew to Boston, arriving in time for the start of APGV that afternoon. Now I am hanging out in Boston, APGV has finished and SIGGRAPH is about to start.

APGV was really interesting, especially since some of the papers presented related very closely to the virtual environment work I am doing this summer. Some of Bobby Bodenhimer's students at Vanderbilt were presenting their work on joystick vs. gain navigation in a virtual environment presented via headmount, which is really similar to the work we are doing. It was really cool to actually meet someone whose papers I have been reading all summer, and to see presentations on new work in the area. I guess it really helped me to understand how researchers build off each other's work. It was a pretty small conference, about 100 people, compared with the ~30,000 that will be at SIGGRAPH. Some of the papers were very specific and I didn't really have the background knowledge needed to understand them, but I still feel like I learned a lot simply by observing the small conference atmosphere. So, now I am starting to get really excited about SIGGRAPH. It looks like it is going to be a kind of overwhelming experience, since there are so many different things to see, but I am sure it is going to be great!

Main Menu


Week 6: July 31 - August 6


Wow, okay, so SIGGRAPH. Where do I even start? The whole conference is kind of like a big show. The papers are all presented in huge halls with huge screens both to see the powerpoint presentations and second screens to show the speak, because they are usually too far away to actually see. There is so much to see that there is no way to hit it all, so I tried to mix it up and see a little bit of everything. I went to a number of the technical papers, and even though some of them were a bit over my head, it really helped me to get an idea of the main research areas in graphics. Since Colby doesn't offer any graphics classes, I was a little bit out of the loop, and even though I thought that I might be interested in graphics research, I didn't really know what it was all about. So this experience has really helped me learn more about the field. What really surprised me was how mathematically and physically oriented a lot of the graphics research is. I had always thought of graphics as a more artistic field, which it can be, but especially at the University research level it often involves understanding the physical relationships between different objects and how to correctly calculate their interactions with each other. Or, I guess, that is one facet of graphics that I did not know anything about before coming to this conference.

In addition to the technical papers, I also attended a number of "sketches", which are a sort of less serious research presentations. A lot of them were presentations by graphics and special effects companies discussing techniques used in their recent movie productions. Those were really fun to watch, and also displayed a completely different area of the graphics community. I think one of the greatest aspects of this conference is that it incorporates graphics professionals from both academic and comercial backgrounds.

Over the course of the week, I also was able to visit the Emerging Technologies exhibit, the Animation Theater presentation, the Exhibitors floor, and a few panel discussions. Everything was incredible, and really opened my mind to the career possiblities in graphics. Besides the benefits of actually atending the conference, I learned a lot from the social experience of attending SIGGRAPH. I was introduced to a number of famous researchers in the field, and met up with a few friends to talk about my graduate school options. It seems that besides being an outlet for presenting research, the conference is also a means of getting in touch with other researchers and connecting with old friends. So, yes, it was a pretty cool experience.

Main Menu


Week 7: August 7 - August 13


I am back in Minnesota after my week-long conference adventure. I got back and suddenly realized that I only have three weeks left here, and there is still so much left to accomplish! So, this week I have been working really hard on perfecting the experimental design. I met with Vicki twice over the course of the week and we came up with a potential set of tasks for our experiment. The basic idea is that we will place the test subject at a certain location in the center of the city at the begining of a trial. There will be four different targets hidden nearby in the city, but out of sight from the starting location. We will first teach the subject the locations of the targets by having them follow a breadcrumb path to each target. Next we will ask them to point to the targets from the starting location using a wand tool and take data for their angle error. We will also test how accurately they can walk to the targets' locations without the breadcrumbs or targets visualized, calculating their distance error. Finally, we will ask the users to walk to target 4 and see how accurately they can point to targets 1, 2, and 3 from this location. We are hoping that by collecting these three different data measurements, we will be able to understand their comprehension of the spacial relationships between the targets. We will have each test subject complete this series of task two times, once navigating using seven league boots and once using the joystick to navigate.

After coming up with an outline of our tasks, I set to work coding them into the program. I worked on placing the targets in the city, creating paths to each target, and coming up with a way to translate the starting position to different locations for each separate trial. At the end of the week Vicki did a test run of one trial, and found that the tasks were very difficult. One of the main problems with the design is that all of the city buildings look very similar, making accurate navigation difficult. It feels more like a maze than a realistic city. So, we thought for a long time about how to easily solve this problem, and we decided to try coloring the buildings random colors, to see if this would help subjects to distinguish between them. When Vicki test-ran the experiment after the color addition, she noticed a change in her naviagtional abilities, so we decided to keep the colors.

Main Menu


Week 8: August 14 - August 20


This week I spent most of my time perfecting the program so that we could complete a real test run of the experiment. Even though we pretty much finalized our test design last week, I still hadn't coded any of the data collection methods into the program, which ended up taking a lot of time. First I tackled the task of collecting angle error data for the pointing part of the experiment. We decided to have test subjects use our wand tool to point in the direction of the target. I created a visual wand (a simple cylindar) that could be turned on and off when needed. Then I had to animate the movement of this wand so that it mapped the movement of the want tool we have tracked in the room. Then I had to figure out how to calculate the angle error between the direction in which the subject was actually pointing the want, and the desired direction. So, that involved me taking a little vector crash course, but eventually I got it all working, which was exciting.

The other problem I had to work on was figuring out the subject's position in the city model based from the information provided by the tracker. This appeared to be a difficult question because the tracking system gives the position of a sensor in the room, but the city model is not really based on the coordinates of the room at all. So I had to convert room coordinates into city coordinates, and then figure out how to incorporate translation based on modified movement due to seven league boots or flying. It didn't end up being to hard in the end though because the seven leagues/flying translation was already stored in a variable, so all I had to do was incorporate this into my coordinate calculation.

By Friday I had everything ready, so we did a real test run with Lee, a colleague of Vicki's. This was partially to make sure that everything could run smoothly and that there were no bugs in the data collection code, and partially to get his feedback on our experimental design and methods. There were some data collection bugs, so it's a really good thing we ran it. Additionally, Lee had a ton of suggestions and ideas. I guess the main thing is that he is not sure whether the data we are planning to collect will actually help us answer the question we are looking at. He said that in order to perform well on the task, he felt like he was mostly memorizing the target locations instead of relying his instincts. He also said that everything still looked too similar, making it very hard to remember the target locations and forcing him to rely more heavily on memorization. He also brought up the point that humans generally perform pretty poorly on directional pointing tasks, so this might not be the best type of data to depend on. So, essentially, we still have a lot of issues to think about. This is a little bit frustrating for me because I only have one week left here in Minnesota, so it looks like I will not be able to help bring the project to any type of conclusion. But, in whatever case I will finish up as much as I can in my last week!

Main Menu


Week 9: August 21 - August 26


This week Vicki and I have been going back and reading papers about previous studies where researchers have asked subjects to point towards targets as a measure of spacial orientation to see whether this method has been known to work. We are also looking into the effects of path complexity on performance in similar studies. Additionally, I have fixed up all the bugs in the data collection part of the program. I have been looking into the possibility of uploading models of buildings made in Sketchup into our city model to increase the visual complexity as well.

By the end of the week I had finished the program enough that it is ready to be used for experimental testing! That is really exciting, because I feel like even though I am leaving without finishing the project, at least I have accomplished something useful that will help Vicki get everything finished for our September paper deadline. I have also been doing some writing for the paper, which is pretty fun. I have never really done any technical writing, so this is really good practice for me.

Well, I guess that's it! I'm going home on Saturday, so look for my final report in the near future!

Main Menu


Main Menu

Name: Eleanor "Nell" O'Rourke

Undergrad: Colby College, Waterville Maine

DMP Institution: University of Minnesota

Class year: Senior

Majors: Computer Science, Spanish

Home Town: Northampton, Massachusetts

Email: emorourk@colby.edu


Main Menu

Name: Dr. Victoria Interrante

PhD: University of North Carolina at Chapel Hill

Current Institution: University of Minnesota

Area of Research: Immersive Virtual Environments

Website: http://www-users.cs.umn.edu/~interran/


Main Menu

Here is my Final Report (PDF): Final Report