| Tuesday, July 25, 2006 |
|
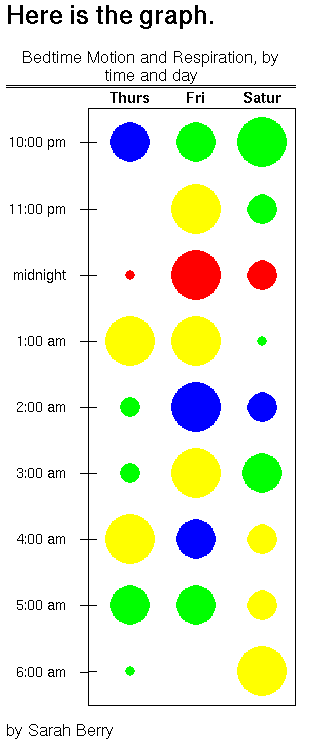
The bubble graph is complete (version 5). Tomorrow morning I want to try to implement it in Catalyst. Nate had the great idea of having the server-side script write the variables into a string that could then be interpreted as javascript on the page. It sounds a lot more straightforward and like less work than my idea, which was to have the server store the variables in hidden elements on the page as it wrote the page, then have the javascript go through those hidden elements and pull the data out of them. I'm to give a demo at the meeting at Tigerplace tomorrow. I'll demo the page with the bar graph that I've been working on, and I would really like to get the bubble graph tied in so I have something more to show. I want to make a quick tweak to the bar graph so that the calendar starts at today's date. Also, the title doesn't come up quite right on the first load. Here's a screenshot of the finished product!
|
|
| Last Updated ( Tuesday, 25 July 2006 ) |
| < Prev | Next > |
|---|