|
Journal
|
|
Here's a handy command: whereis FILE
Great for searching recursively for a certain file; a bit like "grep" for filenames instead of file contents. I figured out how to change the fonts on the graph. I had to make sure that I specified at the beginning of the file that I was going to use GD and GD::Text, and I specified where the program should look for installed fonts. Since I'm using strict, if I don't say "use GD," I get a (misleading) error message about using barewords with strict and so on. Anyhow, the graph can now use system TTFs or built-in GD fonts, and the graph is a bit more readable now. I do need to have the graph adjust when there is a lot of data, because the labels overlap and are unreadable. I removed the "order_by" bit from my query, since it actually wasn't affecting the results and could confuse someone (for example, me!). The graph shows how many times the sensors logged a certain level of restlessness while a person slept. Problem is, every time a restlessness level of 4 is logged, levels of 1, 2, and 3 are also logged immediately before. In other words, it has to go through all the lower levels first. This can distort the data towards the lower levels. I wasn't sure I was completely clear on the concept, so I checked through the data, and it almost never violates this rule (less than 5% of the time in all cases I searched for, and actually less than 1% in most cases). It's possible that most exceptions can be attributed to a missed data signal, since I'm told that the X10 wireless protocol doesn't do handshaking*. I thought about trying to correct the data by tweaking my database query, then decided that that was too complicated and just processed the data programmatically after it was pulled. The graphs are now correct.
I showed Chinonye the virtual agents I found and sent her their sites. *coordinating data transmission so that it can confirm that the data it sent was successfully received |
|
Last Updated ( Monday, 03 July 2006 )
|
|
|
Journal
|
|
I got a new project today at the weekly meeting. One of the researchers, Dr. Hamilton, needs some graph mockups for a paper he's writing that's due Friday. I ended up just creating them in Open Office Calc (like Microsoft Office Excel). We're still going over changes, but I've gotten a 3rd draft of one set and 2nd draft of the other sent off. Dr. Keller would also like a graph from me based on the web page I've been working on, so in between working on Dr. Hamilton's graphs (and working out the aftermath of a fender bender I had Sunday), I've been trying to get that graph to display better. (The labels on the x-axis tend to overlap if too many weeks are displayed.) I did find and fix the bug where data after midnight is displayed as the next day (leading to data like "June 1 June 2 June 2 June 4 June 5"). I need to find out from Nate about some interesting data for a person that occurred some months back, and I need to get Dr. Hamilton's feedback on his graphs so I can get any changes out to him. I also have some hand-written notes on scrap paper about things I need to work on. One of those things is learning to use image manipulation software. It's becoming more and more apparent that this is a gap in my learning that I need to address. If these mockups had been less simple, I could have been in some trouble, and this isn't the first time I've felt the need to know how to use something more advanced than Paintbrush! |
|
|
Journal
|
|
I finished Dr. Hamilton's graphs and sent them off to him. I had to do some manual conversion to get them from Open Office Calc into Microsoft Excel, as the callouts didn't really convert so well. Not too many problems besides the callouts, though. I also sent off a graph to Dr. Keller that he had been requesting. I got the x-axis labels on the graph to adjust automatically so that they won't (usually) overlap each other. My next priority is to make the interface better, specifically by implementing the calendar date-picker. (Funny story: Someone was looking over my shoulder at the page and said, "Boy, the University of Virginia sure has an ugly interface there." Guess it's time for me to stop fixing the back end and start on the front end.) I discovered how to select "transparent" as a color in the KPaint program. This could have saved me quite a bit of mucking about with Gimp. I started working on implementing CalendarXP. I couldn't think of an easy way to transfer files from my computer to the server, so I just used Lynx to get to CalendarXP's site and download the files. I didn't know you could just use the "unzip" command to extract things from a zip file in Linux. I'm leaving for the weekend early today, but Monday I need to tweak the graph I gave Keller. For one thing, the last two labels overlap. I set it to only put on 1 of every 4 labels, so they wouldn't overlap, but it still wants to put the last label on, whether or not it's the 4th one, resulting in an overlap. - Monday: See jul6 todo doc.
|
|
Last Updated ( Thursday, 06 July 2006 )
|
|
|
Journal
|
|
I need to replace my alarm clock. It has a bad tendency to occasionally respond to the snooze button by turning the alarm completely off. So the bad news is that I was quite late to work today, but the good news is that I got nine hours of sleep. After taking some time to slog through a few days' worth of mailing list posts from the Catalyst and DBIx lists, I worked on how best to implement the CalendarXP plugin on our page. The download includes some nice demos. I want the user to be able to: - Select a single continuous range of dates (and only that)
- Have that selection span a month or year break
- (Single-click a week to quickly select that week - one demo had that feature and I liked it)
- See the selected range visually indicated on the calendar
- View the entire selected range, or at least the starting and ending months
- Deselect and/or start over without a page reload
I played with two different demos. The first one (MultiPicker if you've downloaded the files) was a nice one-month date range select, and I got it about tweaked to where I wanted it. You can select across multiple months, but only one month is displayed at a time, and I'm not sure I like that. 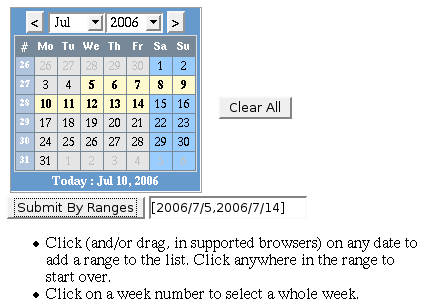
The second one (Tileup) displays 12 months at a time. I tweaked it to scroll a month at a time instead of a year at a time. Selecting ranges works, but it doesn't automatically flow over the month breaks when you select. 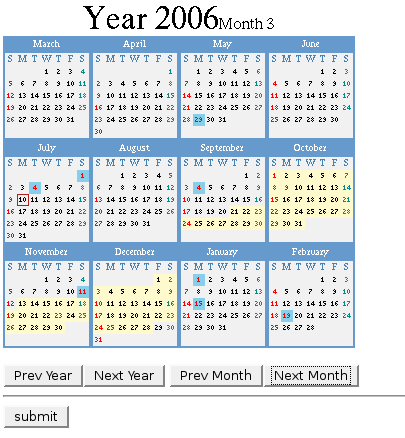
I may search the forums to see if anyone else has tried to select across a month break. Or I may have to reexamine my wishlist and sacrifice some things. Overall, though, I'm pleased by how close the existing demos are to what I'm looking for. On another note, Catalyst 5.7000 has been released, and I wonder if we should upgrade. Documents to keep in sync with: - progress lately, jul 6
- jul10 (largely a scratchpad)
Also, insert screenshots here and clean up this post (validate?)
|
|
Last Updated ( Tuesday, 11 July 2006 )
|
|
|
Journal
|
|
I made great progress on the calendar today. I have a calendar put together that displays two months at a time. They "scroll" together - you can go to prev/next month/year. Entire ranges cannot be selected. You can choose up to two distinct dates (which will later be start and finish) on those calendars. If you choose a third date, the first one you chose drops off. That part took the longest -- getting two calendars and their container to all talk to each other. Now that I've done this and have a better understanding of the code behind this demo, I wonder if I could implement highlighted ranges after all. I was having trouble with highlighting across the break between months, but there's a chance that it might simply have been failing to redraw one of the calendars after the dates were selected. If that's the case, it would be an easy fix, but a lot of backtracking and changes. I will look at this tomorrow, because I think I would rather have the user be able to select a range; I feel that's more intuitive. Here's a screenshot of my demo page: 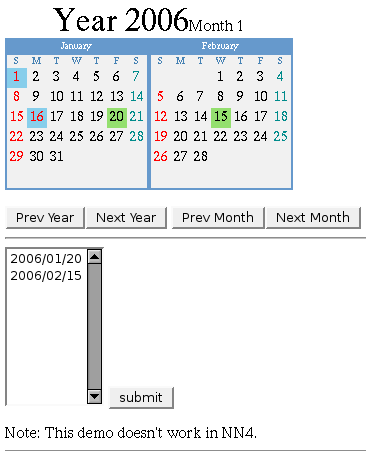
(Blue dates are holidays and will probably go away; green dates are user-selected.) Tomorrow, I think I'll try to put this into the dbixdemo page so that I have something to show for all this work. Even if it's not finished, it will allow me to quickly demonstrate to someone how I've been spending my time. Documents to keep up with: - progress lately, jul 6
- jul10,11 summ (scratchpad)
Don't forget to do tomorrow: - Put calendar into dbixdemo for demo purposes
- Create copy of my files to work on - save this copy!
|
|
Last Updated ( Thursday, 12 October 2006 )
|
|
|
 - Read journals