Journal
Week 1: May 25th - May 31st
It was an eventful Sunday with lots of delays but I finally arrived at the UTD campus on May 25th. Unfortunately by the time that I arrived I did not have time to go gather needed items from a store. So the first couple of days I simply settled down and bought much needed items. I also met Michael, who is also at UTD for the DREU program. The first few days also included exploring the campus and getting lost around the area. We met prof Alvaro Cardenas on May 28th and we were given a reading to do to get familiar with computer security. The next meeting was the following Friday, the 30th. On Friday we talked a bit about the reading and we were asigned to install Security Onion, a Linux OS based on Ubuntu whose focus is on security. Oh I also had Jack in Box, which was pretty good. Next up Taco Cabana?
Week 2: June 1st - June 7th
The second week of the DREU comprised of getting familiar with Security Onion. We were also assigned to finish and look
at the Bro exercises found here: Bro Exercises. The Bro Network Security Monitor is a powerful tool used for intrusion detection. There are two
essential components that make Bro the powerful tool it is. The Event Engine is used to transform the packet stream into events, which abstracts much of the
complexity of dealing with packets. It is the job of the Policy Script Interpreter to decide what to do with the events. During this week I completed the first half of the Bro exercises and began to look into other tools such as Splunk. The end of the week was also when we set particular goals for the DREU and set up a normal meeting schedule of meeting every Tuesday and Thursday for the rest of the DREU.
On a personal note I was also able to visit Whataburger, it may not be Taco Cabana but I had a very greasy and delicious burger. I was pretty happy that day. This week the mini fridge also arrived, which means that I was able to get actual groceries and eat better food than just ramen, although ramen is just so convenient.
Week 3: June 8th - June 14th
During this week I spent finishing up the Bro exercises. I have to admit that after finishing the exercises I was impressed by the capabilities of Bro. Although at first I found the exercises a bit on the annoying side, the last couple of exercises were quite fun. In particular I would have to say that the sixth exercise was not only the most engaging but the most fun to complete. After finishing the exercises I feel that I have a better understanding of not only Bro but also on network security. This week we were also assigned to do a write up on Bro and on the exercises, this will be done by the end of this week/early next week.
Prof Cardenas gave us the good news that we will most likely be able to work with the Industrial Control System data. All 1 terabytes of it. I am very excited and can't wait to see if we get ahold of this data!
Week 4: June 15th - June 21st
The first part of this week consisted of finishing the write up of the Bro exercises. The meeting on that Tuesday consisted of talking a bit about the write up and discussing other IDS programs such as Snorby and Sguil. The rest of the week was used to explore Snorby and figure out how it works. This information would later be added to the write up.
On Thursday of this week was also the day of a holiday that I had never heard of. Juneteenth was made a Texas state holiday in 1980, it is a day to celebrate the ending of slavery in the United States. At UT Dallas this day is celebrated by a cookout, live music, and games. I didn’t really learn a lot about Juneteenth at the UT Dallas Juneteenth celebration, but I did find out about the holiday.
Week 5: June 22nd - June 28th
During this week I continued my exploration of Splunk. I really like Splunk, probably as much as I like Bro. One of the things I like about studying computer science is the ever endless exploration of software that happens in this field. Every now and then you come across some program/software that is just a joy to work and learn with. Splunk to me is that program, things just worked. Splunk is simply a way to index machine data. In our case this means network logs. Once index Splunk makes it possible to search this data. There is also many plugins, such as one for Bro(which I couldn’t get working), and another for Security Onion. But I digress, this isn’t meant to be some kind of badly written software review. The Thursday meeting consisted of giving a short presentation on Splunk and discussing the VAST challenge of 2013.
Mexico v. Netherlands
Although this game happened in week 6 I just want to say that Robben dived. That is all.
😢
Week 6: June 29th - July 5th
This week did not begin to a happy stance. This was because Mexico was eliminated from the World Cup. It's not that I was expecting Mexico to win the World Cup, but I think the last game should have gone to extra time at least if it was not for Roben.
But anyways back to DREU stuff. The Tuesday meeting of this week consisted of prof Cardenas giving us the data from an industrial control system.This data is composed of around 200GB of pcap file. There are two parts to this data, an initial capture and a large capture section. The initial capture is significantly smaller than the large capture, it is made up of 16 1GB pcap files. The large capture is made up of 166 1GB pcap files.
During the middle of the week I began to examine some of the data using Bro. I used Bro to create logs of three of the initial capture files. Doing this gave me some insight into the data. This also gave the chance to work with the modbus protocol, something that I have never done before.
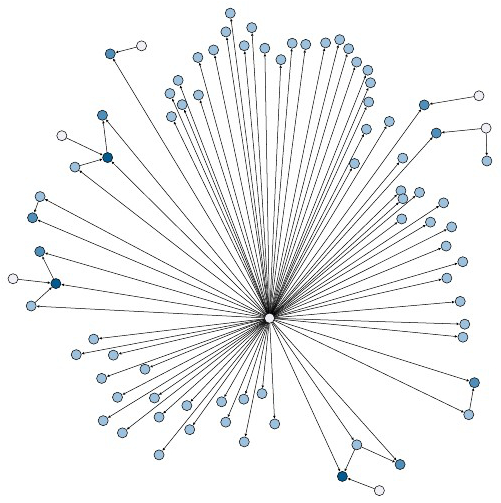
During this week I also began to explore Gephi, a program that is used to create graphs from csv files. I was able to use the modbus Bro log file to create a csv file of the connections. I then used this to create a simple graph of the network using Gephi. I presented this graph in the Thursday meeting. Using the graph we were able to see that there was a central connection that seems to control the systems.
Towards the end of the week I began creating Bro logs for the large capture pcap files. I created a python script to create and organize the Bro logs.
Week 7: July 6th - July 12th
The seventh week was a bit busy. The beginning of the week consisted of creating the Bro logs. At first I thought this would be pretty easy since I had already made the script to automate the process. However there were a number of problems, such as my virtual machine freezing, and the speed at which the Bro logs were being created. After looking online for possible reasons for this, I was able to figure out that the problem stemmed from the fact that Virtual Box does not support USB 3.0 mass storage devices very well. This meant slow read and write speeds to the external hard drive that contained the pcap files. This also meant unusual behavior from the virtual machine.
After a couple days of continually working on creating the Bro logs, I was finally able to finish creating the Bro logs. During the Tuesday meeting of this week we discussed how to examine the data. Another of the students working on the project had already analyzing the data using Splunk. Prof Cardenas suggested that we try and create a data structure that would contain the connections at each time, as well as hold the protocol used by that connection.
After the Tuesday meeting I began working on trying to create a data structure and also began working on learning how to use d3. d3 is a javaScript library used for data visualizations. I am hoping that d3 might help us understand the data better.
The Thursday meeting was a special meeting because we all had the chance to attend an open house at the UTD Security Operations Center. During this time various employees discussed what tools and software they used on a day to day basis. Some of the technology behind the tools was also discussed. It was nice to have a firsthand view of how these different tools are used in a real world scenario.
Because of the open house, we also had a meeting on Friday. During this meeting Anvit discussed and gave us a demo of his data structure that contained the connections organized by the time of the connection. We all discussed of better ways to implement the data and make it more efficient.
Another issue that was discussed was of how to visualize this data. I have been working on using d3, however I, as well as other, are not sure if this will be the best way to accomplish this task.
Week 8: July 13th - July 19th
This week began by emailing the Bro logs to the other students working on the project so that they may use them as well. Using the Bro logs instead of the pcap files made it so that we could analyze the network with greater ease. I also began working on creating a visualization for the modbus log. In particular I focused on just one of the 166 modbus log files. The reason for this was because I was trying to see how the network behaved and see if there were any ip addresses that behaved in an interesting way.
To create the visualization I first had to parse the modbus log file and extract the relevant information. From previous examinations I had concluded that in the first modbus log there was only one source IP address. This meant that I could examine the log file looking for only the destination IP address and the time stamp. I created a script to output the relevant information into a csv file that would later be used by the D3 code.
The D3 code consisted primarily of organizing the data to make it more manageable. This turned out to be quite cumbersome and made for confusing code. Looking back at this I would say that a better way to do this would be to create a json file and include all the possible relevant information. In other words, do the hard work of organizing the data before using D3. But in the end I was able to create an animated graph that showed how the network in the modbus behaved for the first pcap file.
Week 9: July 20th - July 26th
The visualization of the first modbus file was very useful in painting a picture of how the network behaves. After studying the visualization prof Cardenas agreed with my hunch that there seemed to be a pattern in the way that the different destination IP addresses were being talked to. The pattern looked reminiscent of a finite state machine. Prof Cardenas suggested I try and create a Markov chain.
To begin creating the Markov Chain I had to find a way to enumerate the different ways that the RTU were being accessed. There were 73 different IP addresses, each corresponding to a different RTU. This meant that there are 2^73 different ways that the RTUs can be accessed in a given second. My first idea was to use bit shifting to flip a particular bit whenever an RTU was accessed. For example is the 3rd IP address was accessed then I would shift the 3rd bit of some binary number. In the end each state will have a unique number. However I was using Javascript, and as it turns out, Js uses 32 bits for integers. This mean I had to do something else. I ended doing something similar but using ascii characters instead. In the end I never finished creating the Markov Chain because I found out that in the span of 503 secs there were about 498 states. This means that almost every second there is a different configuration of RTUs being accessed.

Although this was a setback, it did show that perhaps the pattern that was observed might have just been a coincidence. After this I made two other visualizations in the hope of seeing some pattern. Once was of the number of distinct connections being made per second. This showed that ever 26 to 27 seconds there was a significant drop of the number of different connections to RTUs. In general the number of different connections was in the range of 50 - 55. Every 26 - 27 secs that number would drop to less than 45.
The other visualization was a matrix showing when each connection was made in one second intervals. This was useful in identifying a handful of IP addresses that were being connected to in some kind of pattern.
Week 10: July 27th - August 4th
Wow, I can’t believe how fast the weeks passed by. But it is still not over, not yet. This week we had to wrap things up, well we tried to. The first thing that I did on the tenth week was to try and figure out the pattern of the connections. What I mean by this is that I wanted to see how frequently connections to the RTUs were being made. To do this I simply ran a script that kept track of the last time an RTU was connected, then when the next connection happened, I checked the time in between and kept a counter for each time. The then script made a json file for the data. This json file was then used with D3 to create graphs. These graphs are useful in identifying how individual RTUs behave.
After making those graphs, I continued to work on the modbus network. In order to see the entire modbus network I was instructed to make some graphs. One of the graphs was a traditional graph made using Gephi. In order to make the Gephi graph I first had to create csv files for the nodes and edges that would define the graph. To do this I created a script that went through the log files and made edges for each connection.
The last graph that I made was a hive plot. Until then I had never heard of it. After doing a little bit of research online I saw that there was a library for the programing language R. Since I did not have time to learn a new language I looked for other approaches. I ended up finding a library made for D3. Although there was not a lot of documentation for it, it was fairly straight forward and after some trial and error I figured out how to create a graph. But I do have to say that I could have done a better job with it, but was a bit short on time.
*Yum. Delicious grease.