July 1 - Aug 3
As I mentioned in the homepage, because I was injured in a car accident on my way to Oregon for my DREU, I got stuck in my apartment in Urbana. Luckily, the DREU program organizers helped find two new mentors at my home department for me such that I didn't need to travel.
I got the new mentor assignment on July 1st, and I was really excited about working with Prof Karahalios and Prof Hart. Since Prof Karahalios was out of town, and my activities still had to be limited in my apartment, we didn't meet each other in person during this period. However, we kept email correspondence where I introduced my background as well as research interest to them, and they came up with a project idea for me. I was going to do a research project on visualization of audio contents.
They sent me a few links, including Messa di Voce by Tmema, Blonk, La Barbara and work by the composer Iannis Xenakis, to read so that I could get more familiar with the idea of visualization. I was also asked to search for related literature myself.
We had a three-person Skype meeting on July 16th when we started discussing the goals of the vision, and made some potential sketches. Prof Karahalios mentioned a very interesting hypothesis she read from a paper: when two people are talking, they will change their pitches towards each other if they are in agreement with each other. So we decided our goal of the project is to test this hypothesis.Prof Hart suggested mapping the pitch along the time as a starting point for the graphics.
Lessons learned: every visualization has a purpose (e.g. to study a social behavior).
Aug 4 - 14
On Aug 4th, I attended Prof Karahalios' Social Space group meeting during which I met Prof Karahalios' personally for the first time. I was super excited and very glad to be introduced to her graduate students Tony, Eric, Andrew, Brant, and Kora. During the meeting, Andrew presented his visualization of spoken audio which juxtaposed the text and the volume as well as the pitch by lining each word, whose color represents the emotion of the text, with a circle, whose height represents the pitch and whose size represents the volume. We also discussed the title of Tony's CSCW paper which studied the impact of purposely distorted conversation visualization on the dynamic of the group.
Lessons learned: a good paper title should be neither too board to the degree such that searching its keyword will get thousands of irrelevant results, nor should it be too narrowed down such that the paper will hardly be show up in the search results.
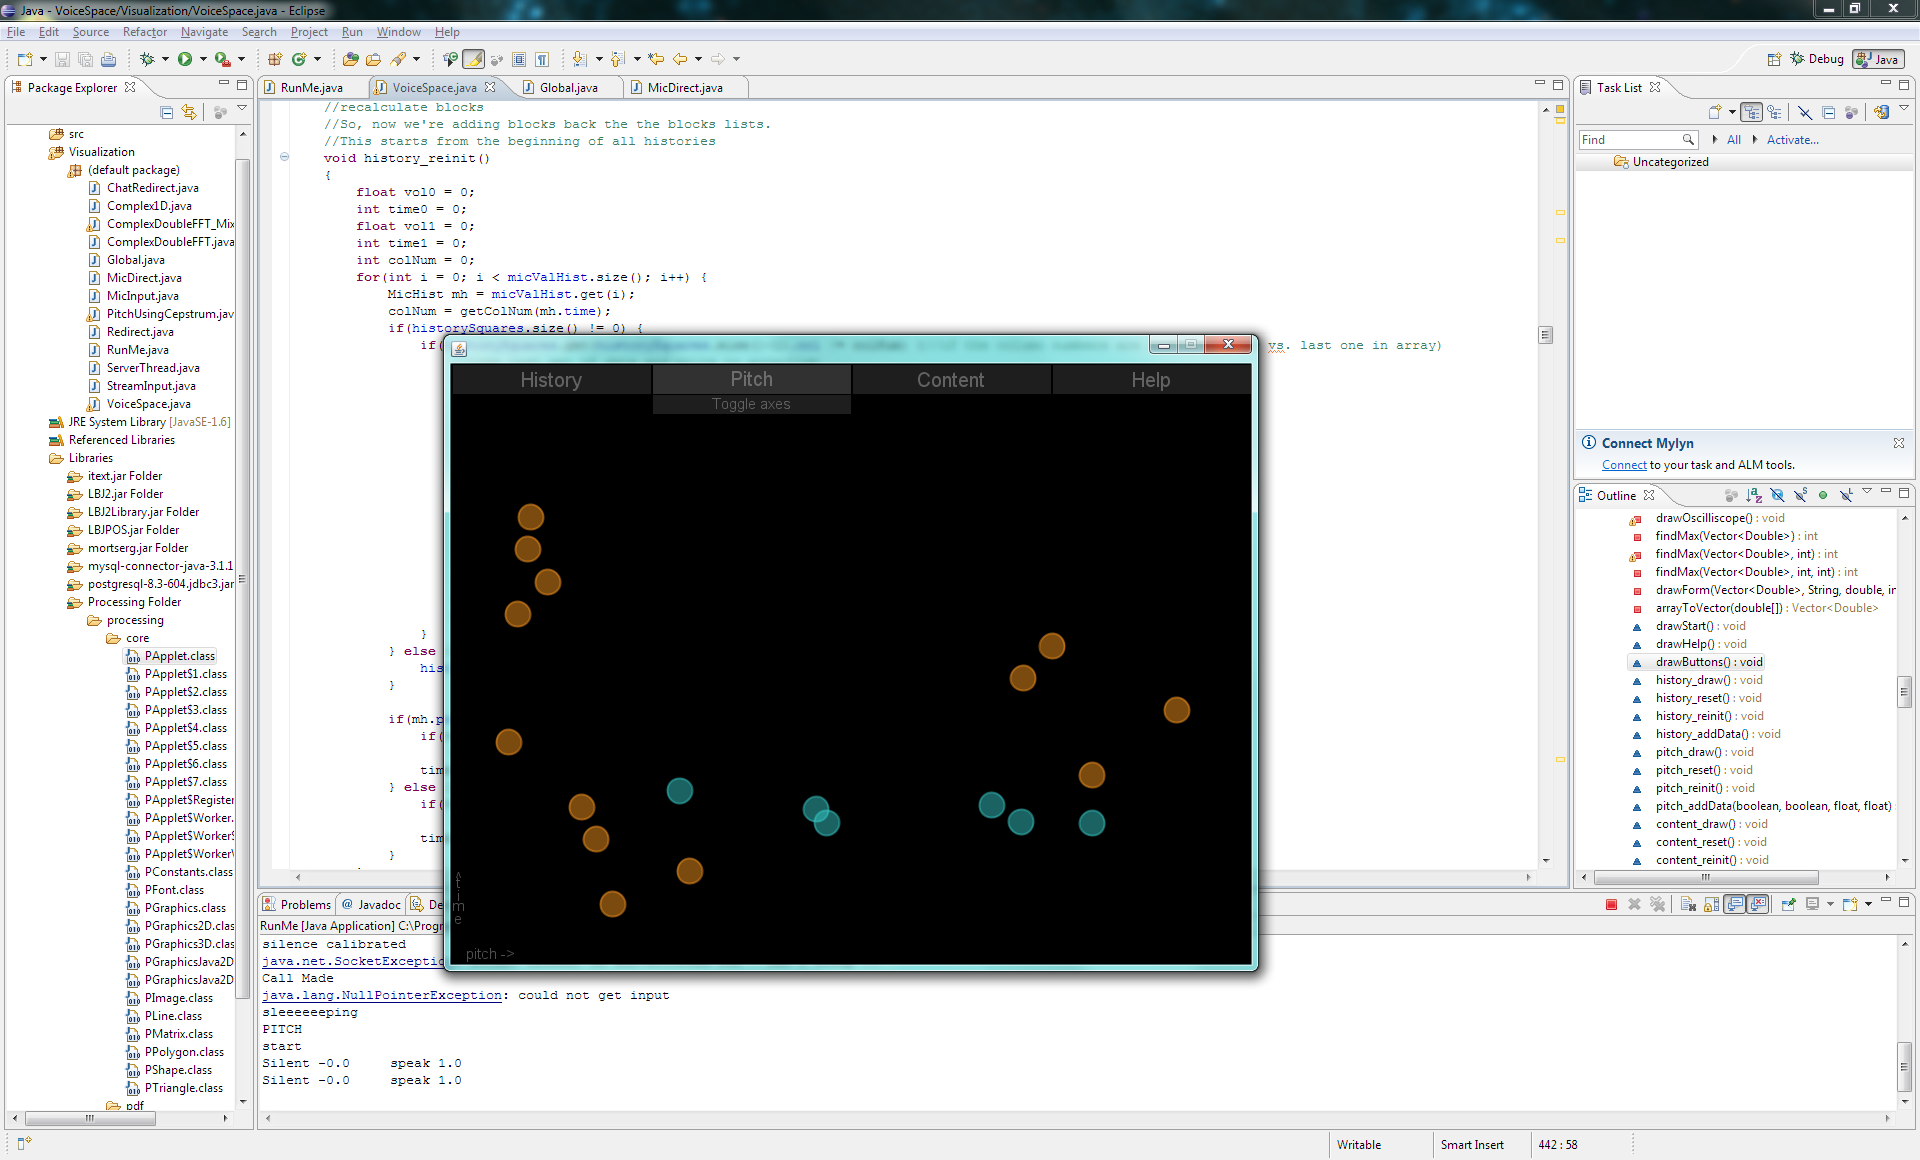
Back to my research progress: I was given the code of VoiceSpace, one of Prof Karahalios' Master student Pooja's project that visualizes remote Skype conversations. My task was to understand the code, and modify it to suit my research goal. I started by reading Pooja's thesis paper "Visualizing Remote Voice Conversations: Uses from Artifacts to Archival". I had a lot of difficulties in setting up the project in Eclipse on my computer. I was unable to launch the application by running the program. I eventually found out it was because the Skype API needed to be running in a 32-bit JDK and Eclipse while my computer installed a 64-bit JDK and Eclipse. Even more frustrating, after I managed to launch the application, the program could not capture the microphone sound while it could capture signal from my conversation partner. When I switched computer, this error disappeared, so I assumed it was some hardware level device problems.
I finally ran the VoiceSpace project on my computer, and here was a screeshot of its pitch vs volume visualization:
I spent the week Aug 8 - 14 as a CS lab assistant for the Girls Adventures in Mathematics, Engineering, and Science (G.A.M.E.S) camp hosted by the college of engineering at U of I. I taught eighty 7th and 8th grade girls wiki, html, programming and make games in SCRATCH.
Aug 15 - 31
During this period, I brainstormed and sketched a few ultimate desired visualization graphics using Photoshop.
Here is an example (click to enlarge and view captions):
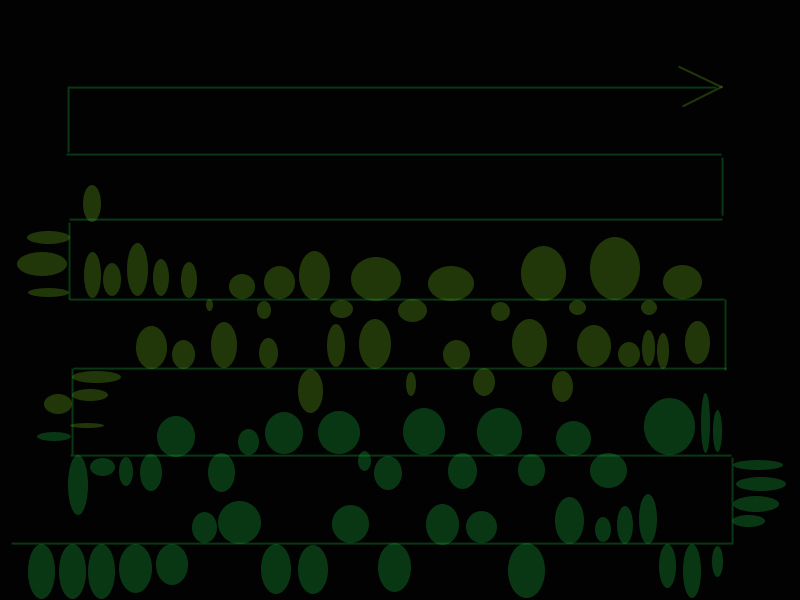
However, after several trial and errors, I eventually discarded all my sketches and decided to stick to the simple mapping of pitch vs time, since it could give us a most direct view of change in pitch.
Since the VoiceSpace project was written in Java and Processing, I spent a few days studying and playing with Processing. I was fascinated by its power in creating visual contexts.
I also cleaned the part of code of VoiceSpace that wasn't related to pitch visualiztion, and integrated the pitch tracking code. It could display circle whose x-axis represents time and whose y-axis represents pitch value when the Skype conversation was launched.
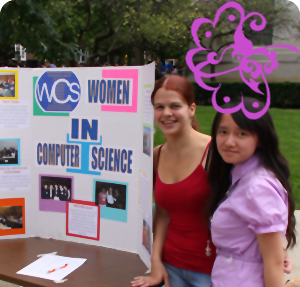
Aug 22nd is the annual U of I Quad day when every registered student organization will have a booth on our main Quad all day. I volunteered for one shift for the Women in CS (WCS) club that day. The school started right following the Quad day, which slowed down my research progress since I had a very heavy course load.
Sept 1 - 22
I managed to connecting two adjacent pitches with a line segment such that there was a line to show the trends of the pitches. However, in my meeting with Prof Hart, he suggested to separate the signals so the overlap between two speakers could be displayed. So I changed the data structure I used to achieve this.
Since the program can only display the data in real time and cannot save any data, I had to launch a Skype conversion to get new data every time I was testing it. In order to be able to analyze the pitch trends after the conversation was done, I added a function to save all the pitch data acquired in a log. Now I could retrieve the data in a very convenient way.
An exciting news was that Prof Karahalios' PhD student Eric successfully defended his thesis. Congratulations to him! It was super interesting to hear about all the anecdotes in the thesis defense in the SocialSpace group meeting.
I also successfully coordinated the first WCS general meeting of the new school year with Yahoo!
Sept 23 - Oct 3
I added a savescreen function to the application so that I can easily save the visualizations.
Since the pitch visualization looked very spiky, I was advised to smooth the signal by averaging a certain number of pitches. I mainly worked on this during this period. I spent a long time to debug my code.
Lessons learned: to be a good researcher, you need to be a good programmer to implement your idea. Programming is the tool computer scientists use to test the theory, much the way chemists conducting experiment to test the theory. And seldom there is a CS paper that has code attached to it.
I got a scholarship from my home department, and spent Sept 28 - Oct 2 in Atlanta, GA for the Grace Hopper Conference 2010. It was super excited to meet so many brilliant female computer students over the world. I went to Fernanda Viegas's presentation "From Politics to Art: Visualization as a Medium", and went on a field trip to GaTech's HCI lab. The DREU Program had a lunch gathering on the third day of the conference, and I found my two friends from other colleges whom I met in the CRA-W/CDC Careers in High Performance Systems (CHiPS) Mentoring Workshop hosted at U of I last summer participated in the program as well!!
Oct 4 - 15
I added a slider to the program interface such that the user can change the number of pitches to be averaged by dragging the slider. By this way, one can easy to observe and compare the change of line due to averaging. However, even after averaging, the pitch line was still very sharp.
I used Mathematica to generate a since wave (Play[Cos[440 2 \[Pi] t], {t, 0, 25}]) to test if the cepstrum algorithm I used for pitch recognition was accurate or not. It gave me a nearly "straight" line, which proved it did work.
I investigated on and experimented with other pitch recognition algorithms. But I didn't get any better visualization results. This was frustrating, since it was very hard to tell its convergence from a spiky pitch line.
In a SocialSpace group meeting, we talked about the history of visualizing the emotion of conversation. It started by building an vocabulary with very obvious emotions, such as happy and sad.
Oct 15 - 31
I added a new widget to my interface - another slider that can show the full scroll of long conversation visualization. I also changed the way how the old slider controlled the range of smooth such that it will give a broader range.
I met Prof Karahalios' student Josh, and he suggested instead of mapping pitches in Hz directly, calcalate the distance between a pitch and 55 Hz in Cents, and then compare and draw pitches in Cents, since graphically comparing the pitch in Hz just won't look right.
I integrated this pitch calculation method he suggested into my project, although it didn't improve the smooth of the pitch line. And to further my understanding of pitch, cents, octive, I did a broad reading on music and sound theory.
I had the GRE general Exam.
I coordinated the October WCS general meeting with Orbitz.
Nov 1 - 15
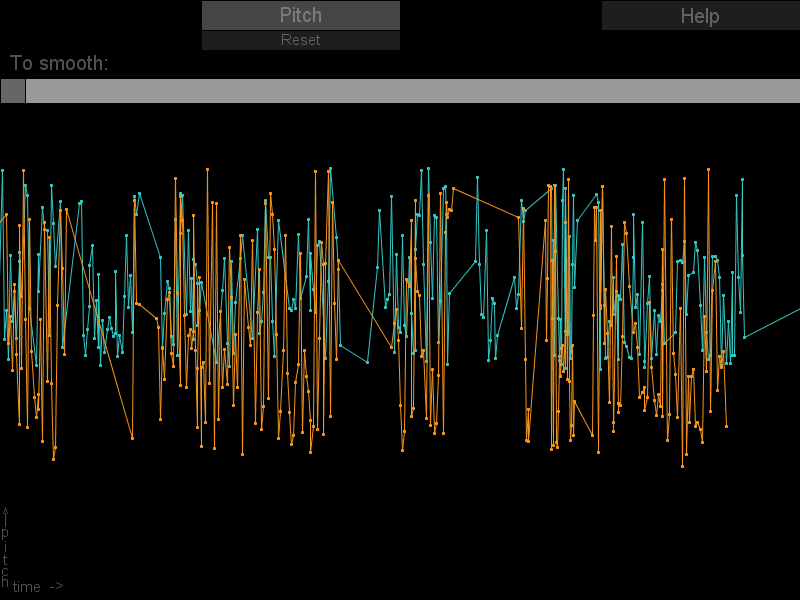
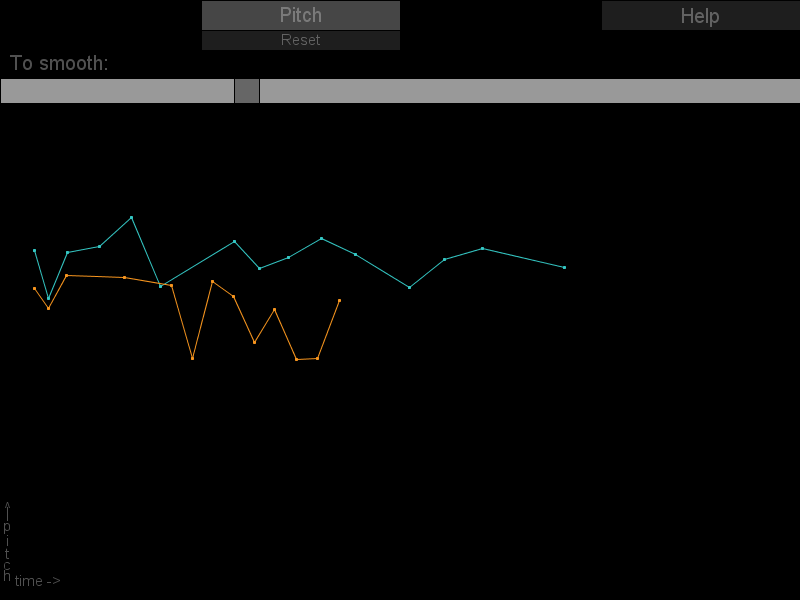
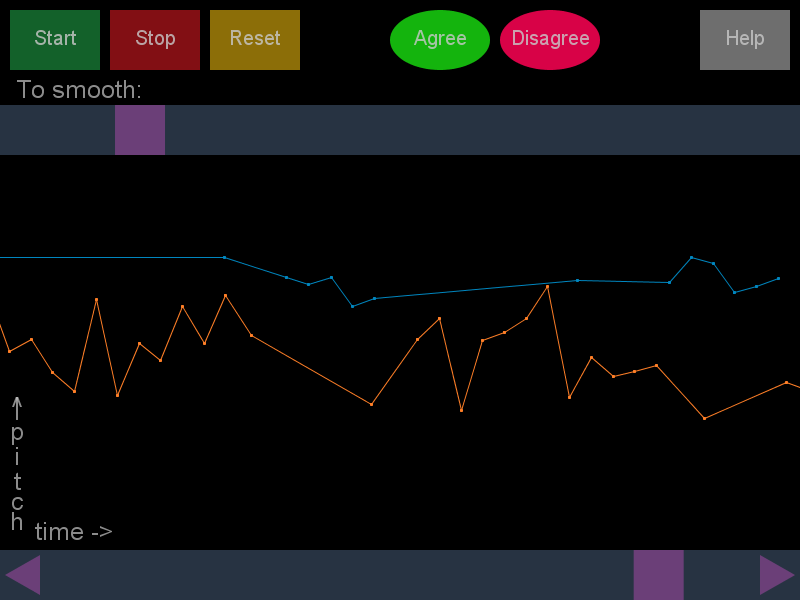
I overhauled my GUI interface. My original interface is a direct modification of the VoiceSpace project. I found the interface wasn't very handy when I tested the application. So I redesigned the interface, and changed the method how the slider controled the view of the screen.
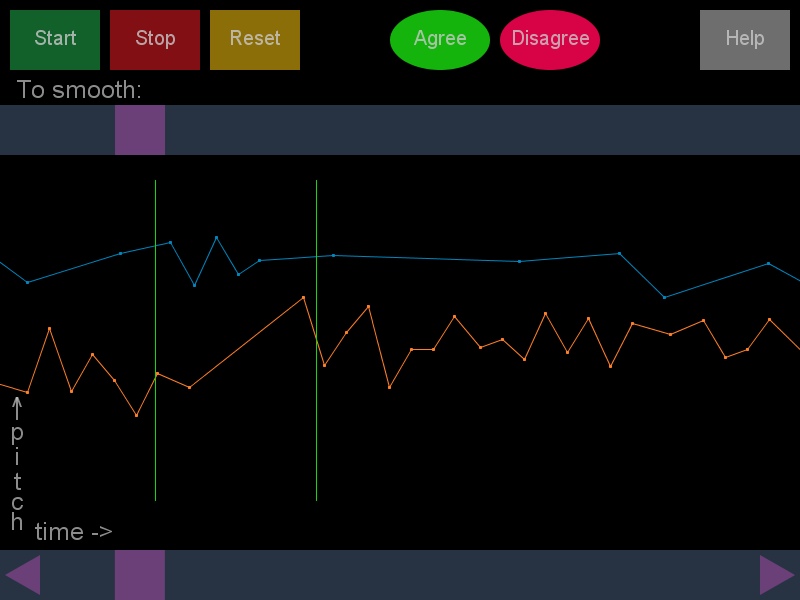
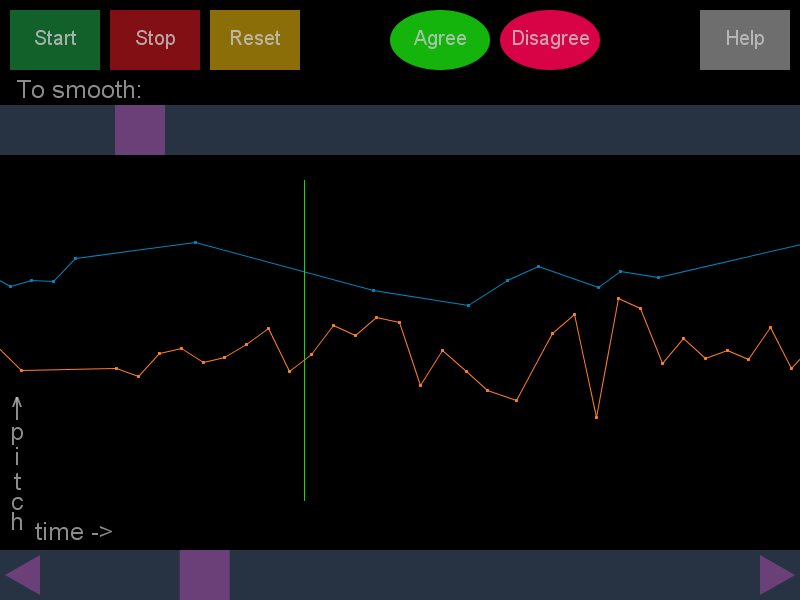
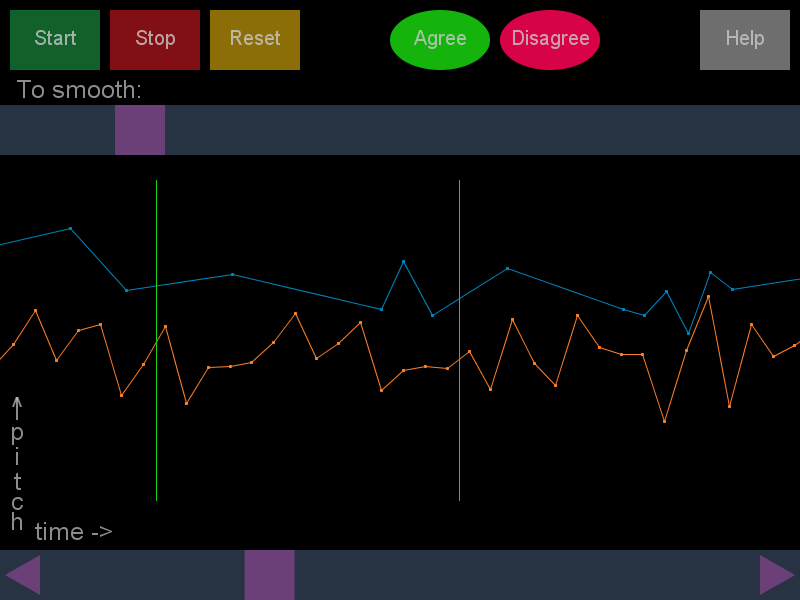
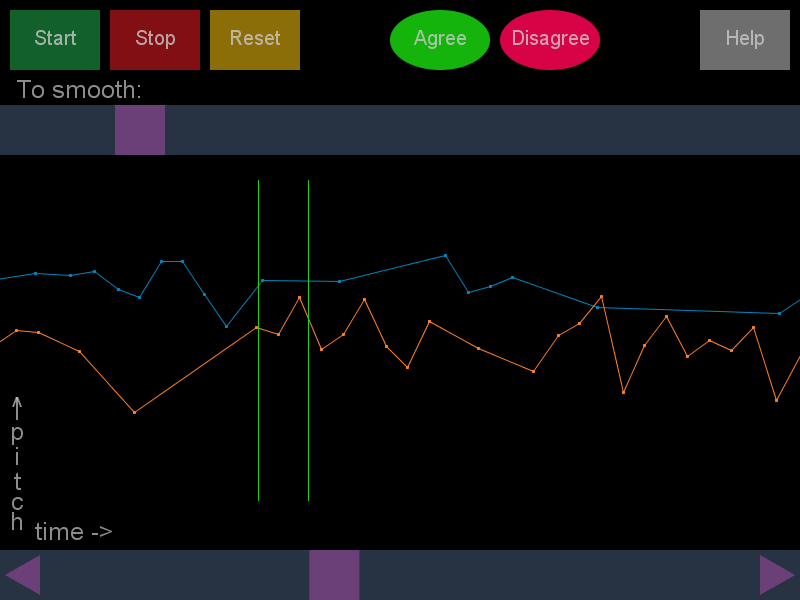
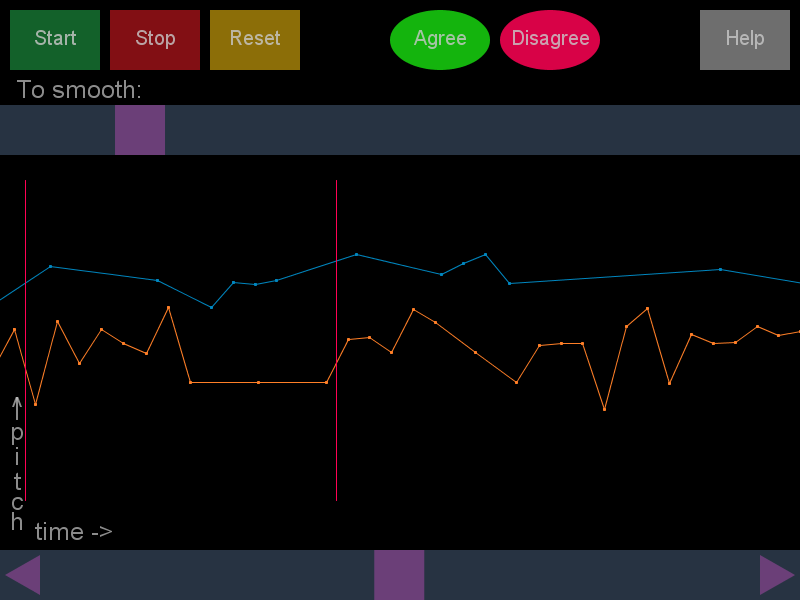
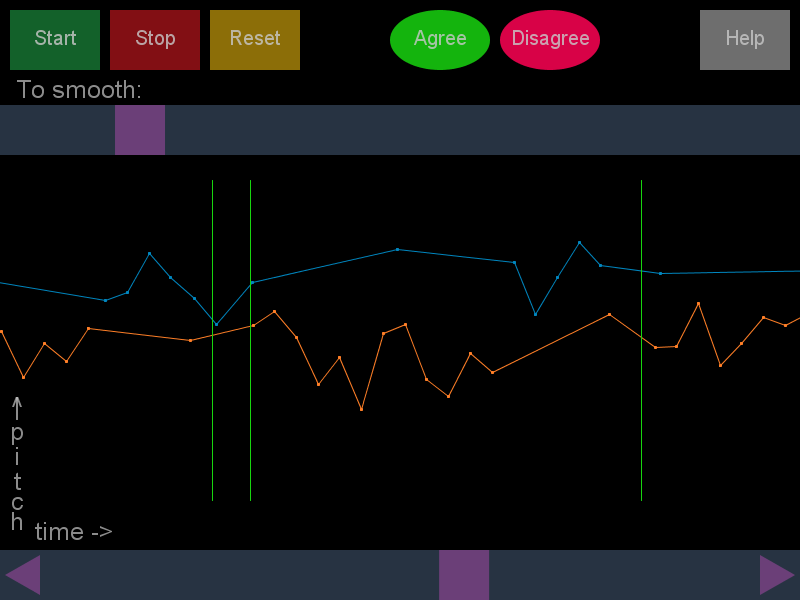
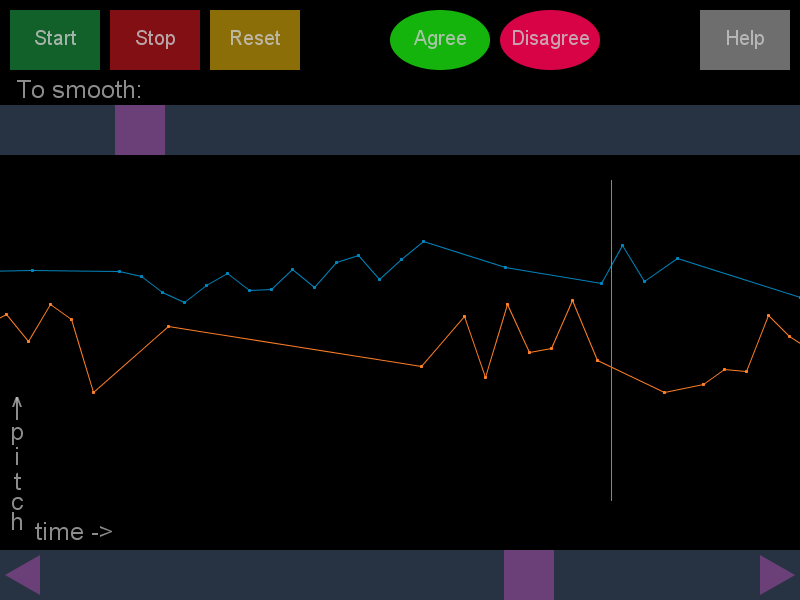
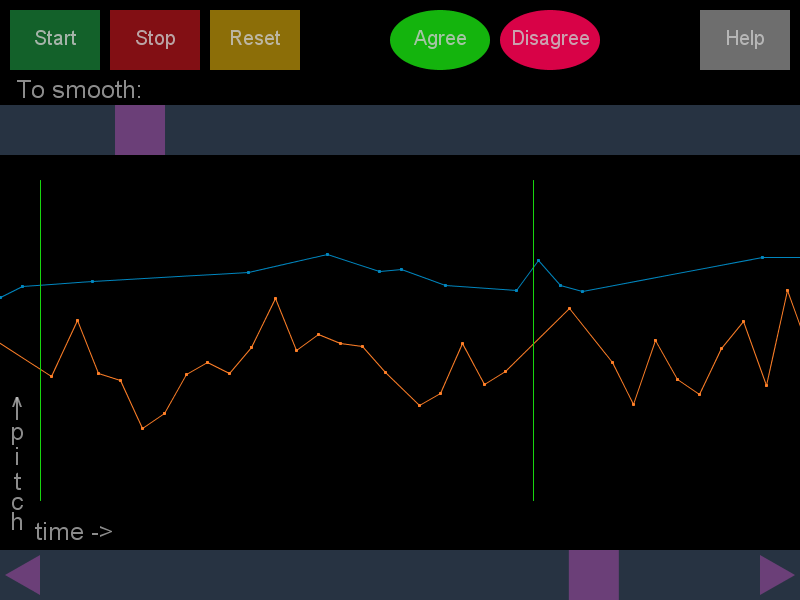
Here are screenshots of the new interface:
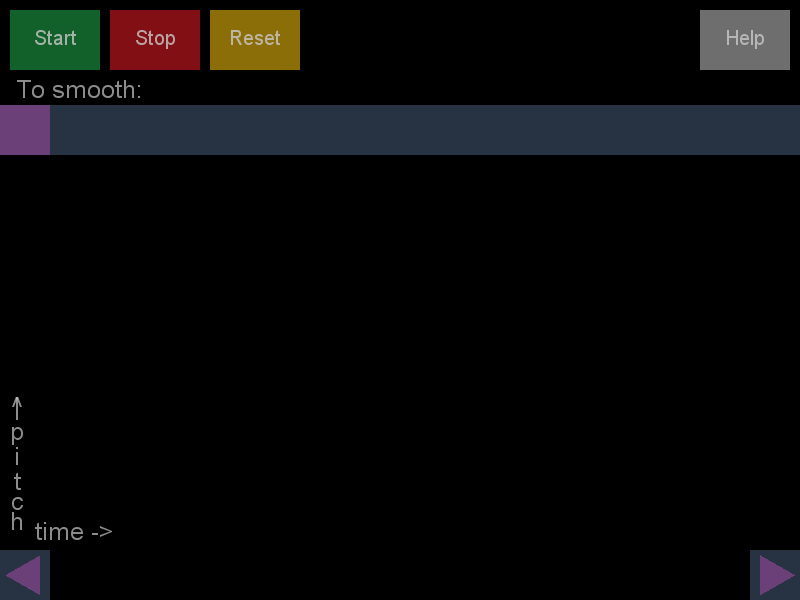
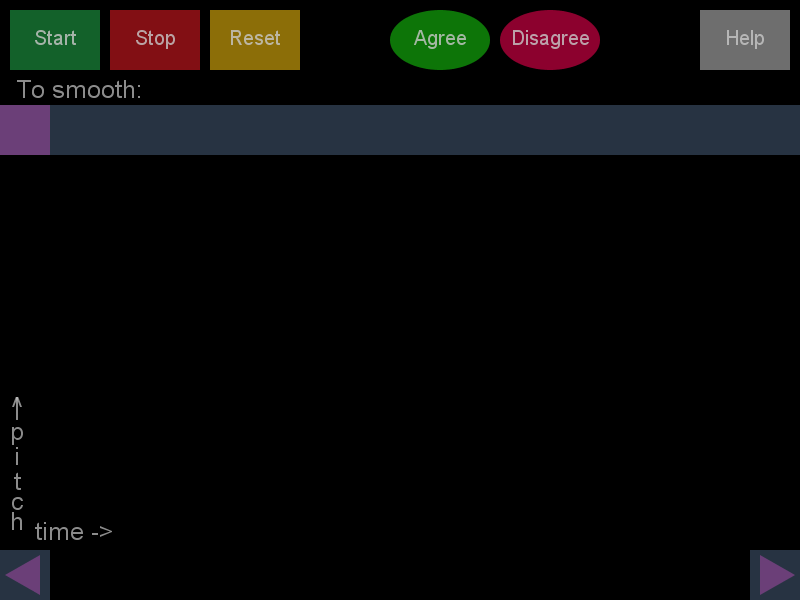
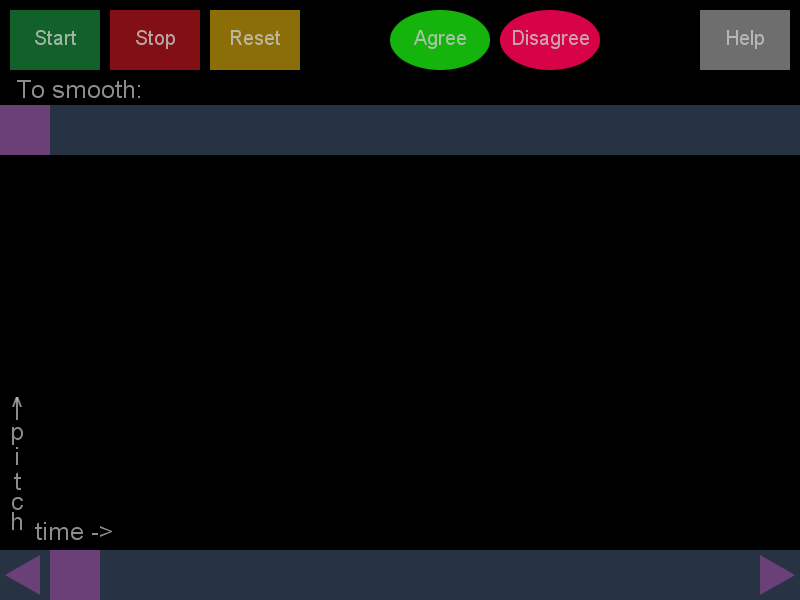
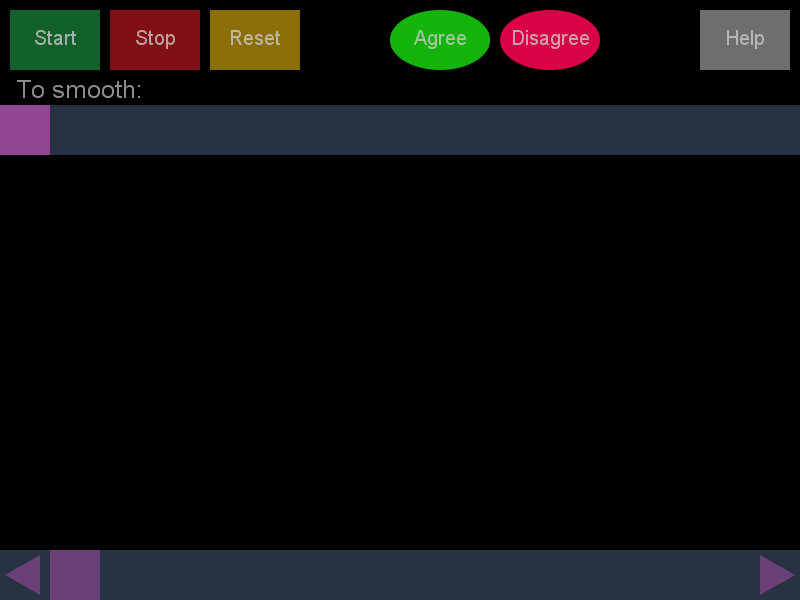
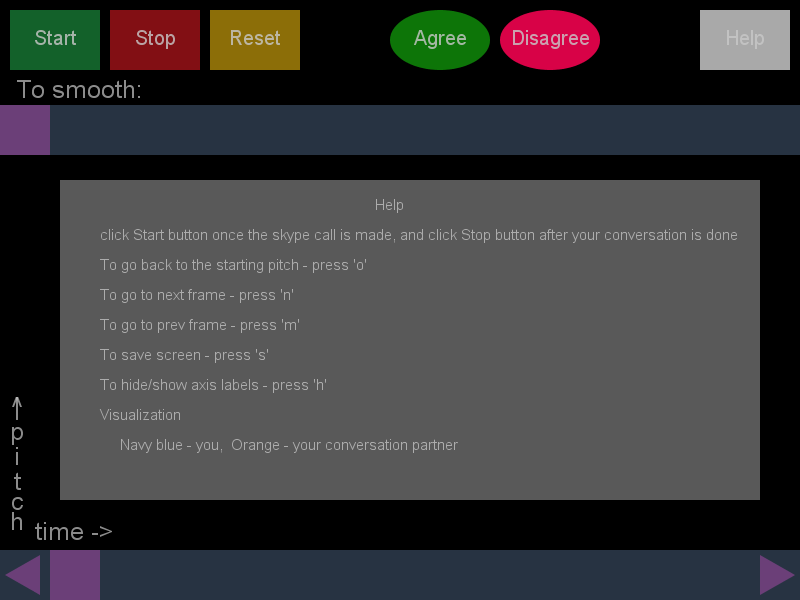
You can notice that I added two buttons to the interface. One is "agree" and the other "disagree". When the conversation is being held, press agree will draw a vertical line on the visulization with time as x-axis, and press disagree will draw a vertical line of different color. When the conversation is terminated, if agree is on, press it will turn it off and hide the line accorrdingly. By this way, I was able to label the agreement on the visulization directly.
I coordinated the November WCS general meeting with Intel.
Nov 15 - 30
With the guidance of Prof Karahalios, I was conducting my first two user studies. My plan was to find two volunteers to discuss one issue on Skype for twenty minutes and record the visualization of their conversation. In my preparation, I realized both speakers in the conversation need to wear headsets such that the sound of his conversation partner won't be captured by the microphone as their own. To monitor the conversation and record the agreement, I need to listen to their conversation as well. So I need an audio splitter and two headsets.
I found two volunteers from the ACM office - Elizabeth and Adam. I let them to decide their own topic, and they chose to talk about the politician Palin.
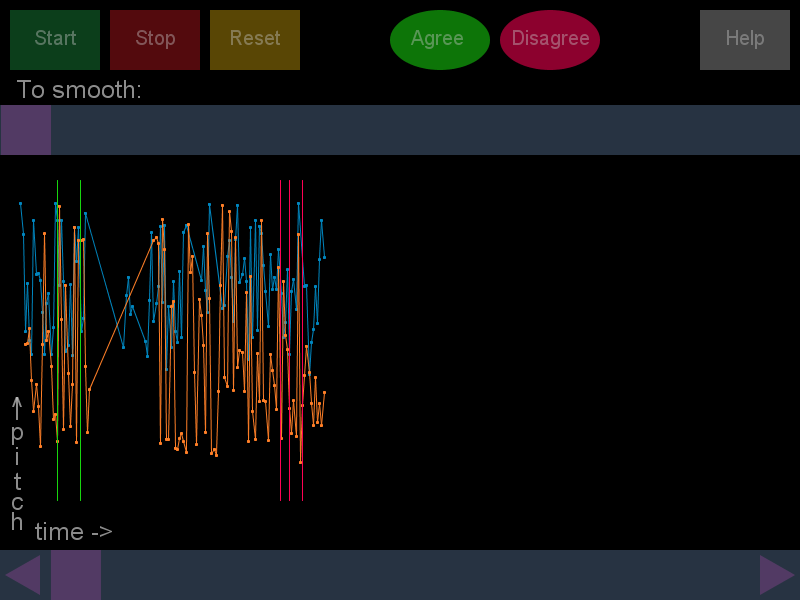
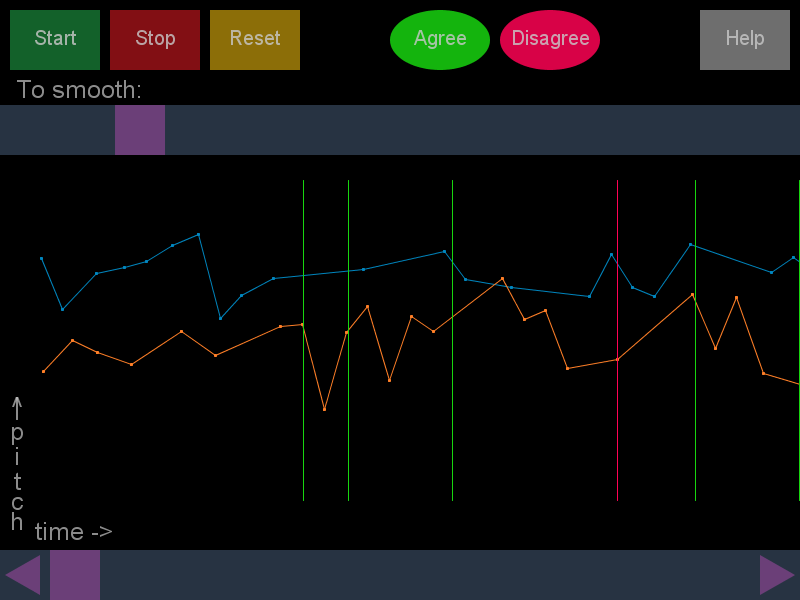
When I listened to their conversation, trying to record their agreement, I found it very hard to judge if they agreed with each other or not. I decided to only mark when they expressed their agreement explicitly by saying words such as "Yes, I agree with you". In addition, I only recorded their agreement at certain time point, but I think sometimes their agreement was continuous.
This user study experience made me start thinking about how can we measure if two people can agree with each other or not. In my experiment, I kind of acted as an intermediator, but I felt my judgement was very subjective.
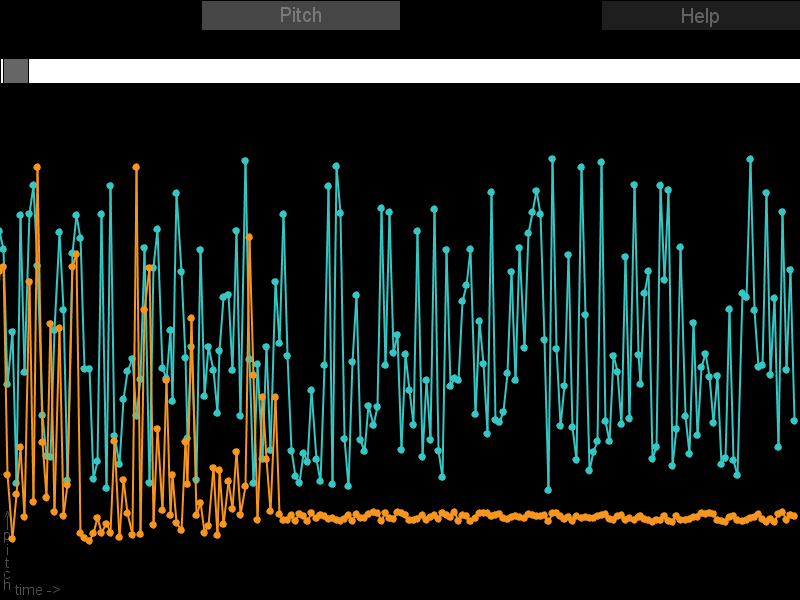
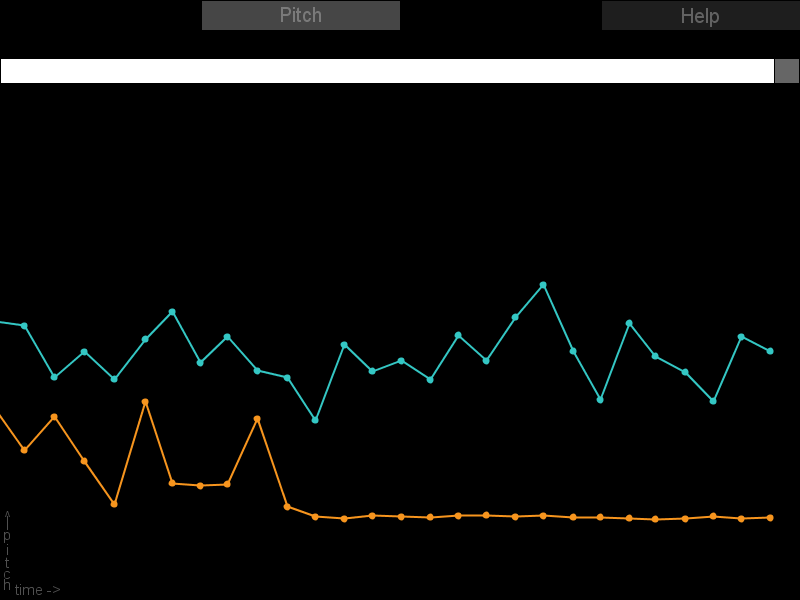
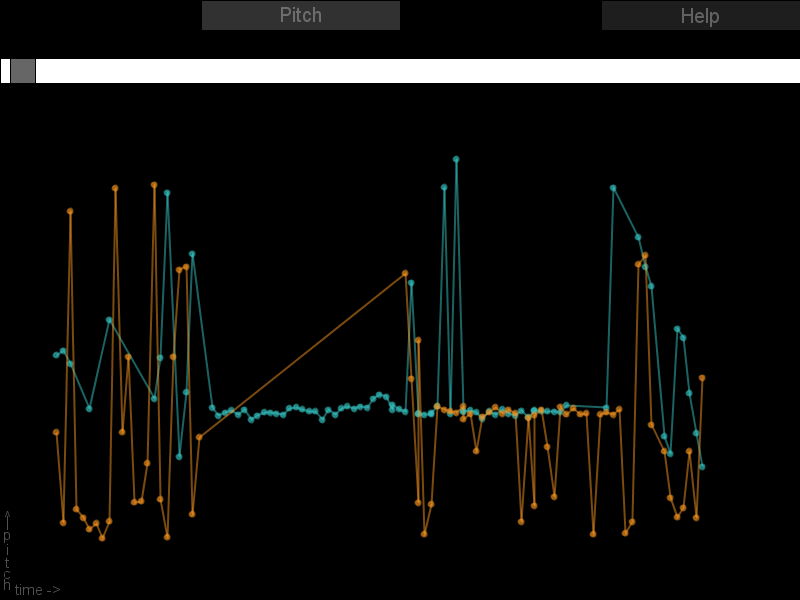
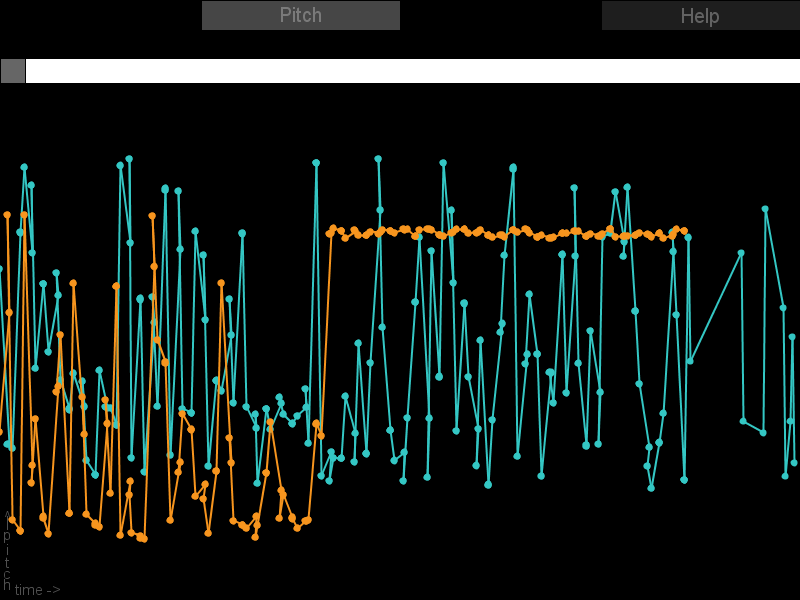
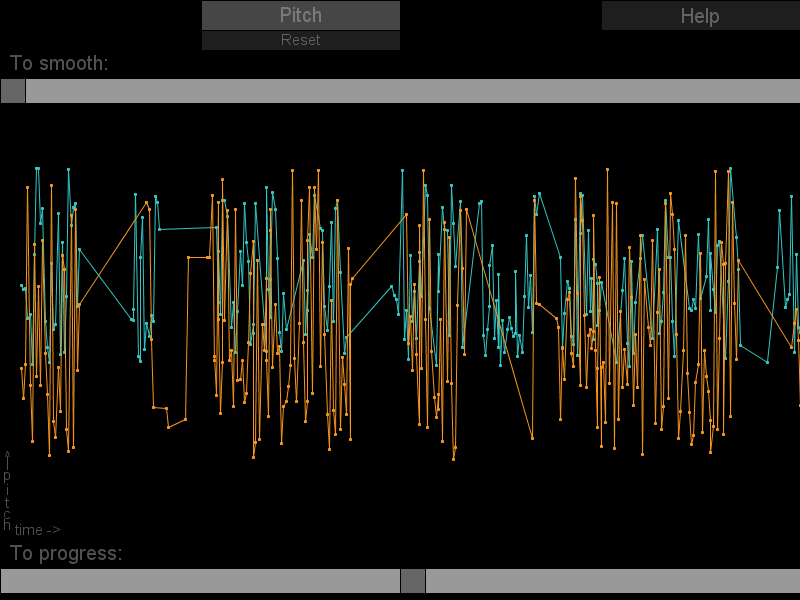
Here is the collection of the result, click arrow to see next view:
Dec 1 - 15
I presented the results I obtained to the SocialSpace group, and was advised to normalize the two pitch line, that is, calculate the average of all the pitches, and align the two pitch lines by its average line. This was the last change I made to my program.
I conducted a final user study with this pitch visualization application.