|
Journal
|
|
The bubble graph is complete (version 5). Tomorrow morning I want to try to implement it in Catalyst. Nate had the great idea of having the server-side script write the variables into a string that could then be interpreted as javascript on the page. It sounds a lot more straightforward and like less work than my idea, which was to have the server store the variables in hidden elements on the page as it wrote the page, then have the javascript go through those hidden elements and pull the data out of them. I'm to give a demo at the meeting at Tigerplace tomorrow. I'll demo the page with the bar graph that I've been working on, and I would really like to get the bubble graph tied in so I have something more to show. I want to make a quick tweak to the bar graph so that the calendar starts at today's date. Also, the title doesn't come up quite right on the first load. Here's a screenshot of the finished product! 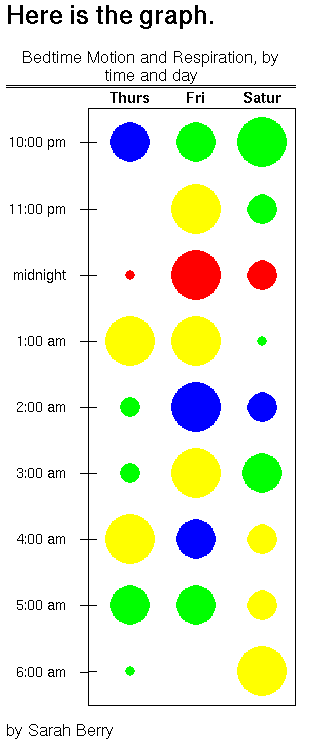
|
|
Last Updated ( Tuesday, 25 July 2006 )
|
|
|
Journal
|
|
The bubble graph works in Catalyst! It calls the scripts, finds the images and stylesheet, pulls the data, arranges it into javascript that is then interpreted by the page, and displays it nicely. I found a bug in my bubble graph code, which has now been fixed (so I am now on version 6 in my files). The only thing is that the page that displays the graph has the date and time ranges more or less hard coded at present. I need to set it up to let the user choose that range. Also, it's extremely slow, which I attribute to the fact that I run a new query for every bubble (i.e., every hour of every day in the range). I will need to rewrite the query so that we can get several bubbles with one query. That will be a bit of a project. Today I demo'd my bar graph page at the weekly meeting. People seemed to really like it, and I got some good feedback on how it can be improved. Dr. Skubic had some ideas for how we can display more measurements on the graph. I'm going to make the bars horizontal so that long ranges of data can be displayed more easily - the user can just scroll, so we don't have to squish all the data to an unreadable scale. Come to think of it, why not just keep it as is and let them scroll horizontally? I should ask about that. One possible reason might be that horizontal scrolling is less common, and you might not be able to just whirl your scroll wheel to view it. Dr. Skubic also asked me to show them the bubble graph mockup that I had. I had hoped to have the bubble graph fully operational by the meeting, but I couldn't get it done in time. There was some good discussion about the bubble graph as well. My project for tomorrow will be to make all those changes to the bar graph. I'll table the bubble graph for a while. |
|
Last Updated ( Wednesday, 26 July 2006 )
|
|
|
Journal
|
|
I found a better query that can pull all the data for the bar graph at once, instead of looping for each day. If I can get it working with DBIx, it should give us a great improvement in the speed when large ranges are queried. I can't quite get it working. I sent out a question to the mailing list. If I don't hear back, maybe I'll look into just using straight SQL. I worked quite a bit on my site today. I found out how to customize some small things that had been bothering me, and as you can see, I applied a new template. Nate gave a presentation on what we will need to know about installing the PC appliance when he leaves. I started looking at installation of the PopCalendarXP. I think there will be a lot less work to this one than the other one. The demo I'm basing it on is very close to what I want in the finished product. Dr. Skubic showed me a really cool visualization. It's sparse, but clear. I will work on this new "timeline" visualization and the bar graph, and leave the bubble graph alone for now. We talked about the paper I'm supposed to write about my research experience. Dr. Skubic had the idea for me to focus it on participatory design. I can show my visualizations to the nurses again on Wednesday and have them give me some more feedback on them. |
|
Last Updated ( Friday, 28 July 2006 )
|
|
|
Journal
|
|
Today us undergrads threw a fiesta, complete with sombreros! We've been wanting to do this all summer. Since today is Nate's last day, it was also a goodbye for him. Yesterday I learned how to make network cables. Today I made a couple more and learned how to test a crossover cable. I got the new query working! I have a feeling that I'm not really using DBIx::Class to its full potential, since I basically just used it to reconstruct my SQL query, but it works and I didn't have to pass it straight SQL. The difference in speed is significant. I'm working through an issue with blank bars not showing up on the graph with this new query, but I've almost got it straightened out. Nate taught us about SSH, port forwarding, and tunneling. We learned to use VNC. My last day is in less than 3 weeks, and I probably have about 8 days of work left. I cleaned up my documents today. Note to self: I'm working off these now: - master todo jul 28 (do not use "progess lately" again!)
- jul27
|
|
Last Updated ( Monday, 31 July 2006 )
|
|
|
Journal
|
|
I fixed the bar graph. It took longer than I thought. I kept having to add tweaks here and there, until the whole thing was so ad-hoc that I scrapped it, sat down to plan out what I needed to do, and started over. It worked pretty well after that, except for one issue that really had me lost for a while. I'm using a Perl module called EzDate. It's great - you can do a lot of "natural" things with a date, like incrementing it without worrying about going from March 31 to March 32, or comparing dates with the usual comparison operators. The problem I ran into is that when you compare dates, it uses a property called epochday, which for some reason rolls over at 1:00 a.m. instead of midnight. As you can imagine, that was causing insidious, hard-to-catch errors. I ended up just setting all times to 2:00 a.m., since I'm only interested in the date and not the time for that part of the code. But the bar graph is completely functional now, and it pulls the data so quickly! Once I finished that, I worked on the popup calendar. I found out how to limit the range so that the end date can't be more than X days past the start date. It was a lot easier than I expected. You can give it the number of days, and it will take care of calculating months and such for you. I changed the bottom panel from "Clear All" to "Go to today." I did a lot of tweaking of the theme (i.e., colors, borders, and other visual effects), probably more than was necessary, but I feel that now it's easy to use and understand. (I may find out differently Wednesday!) I'm happy with the look and feel of the calendar now. Once I fix the built-in range for allowed dates, I should be ready to put the calendar files into the subversion library and implement the calendar on the bar graph page. What to do next? I don't think I will have time to do both the new visualization (which I haven't started) and the changes to this visualization by Wednesday's meeting. I'm actually not sure if I can get the bar graph page completely changed over by the meeting, but I have a better chance of that than of creating the new visualization from scratch by that time. Maybe I could work on the new visualization the rest of the week after the meeting and have someone show it at the meeting next week when I'm out of town. |
|
Last Updated ( Monday, 31 July 2006 )
|
|
|
 - Read journals