~ Project ~

Research Schedule
Final Report (.doc .pdf)
Research Paper (.doc .pdf)
Definitions
Project Application in Java

Package Descriptions:
edu.umbc.cs.maple.data_generation_MAPLE_N (.doc .pdf)
edu.umbc.cs.maple.graphlayout_N (.doc .pdf)
edu.umbc.cs.maple.adj_rand_index_N (.doc .pdf)

Dataset Description (.doc .pdf)
Application Description (.doc .pdf)
Usefull Links (.doc .pdf)


Research Schedule
(NL - Nataliya Lozova, JF - Julia Ferraioli)

Last Revision: 7/14/05

WEEK 1 (6/6)
- Read about force-based layout and clustering
- Generate a "toy" dataset
- Identify software package to start from

WEEK 2 (6/13) : GRAPH LAYOUT PACKAGES
- Build a simple "interactive layout" system using a k-means approach

LONGER-TERM TASKS
- Do more background reading on constrained clustering, distance
learning, interactive graph layout, clustered graph layout - Get/use at least two other data sets (e.g., courses, airplane flights, movies (IMDB))
- Design and implement more sophisticated clustering and layout algorithms (e.g., based on constrained clustering, distance learning)
- Design experiments and metrics
- Run experiments
- Write paper

SOFTWARE REQUIREMENTS
- open source
- force-directed layout
- spring parameters can be set on a per-edge or per-edge-type basis
- change visual attributes of edges and nodes (including creating "invisible" nodes and edges)
- manually move/pin nodes in graph
- associate attributes with objects/nodes
- integrate easily with other algorithms and software (e.g., clustering)
- java or c++ (??)
- well documented
- scalable to several hundred nodes

KEY STEPS IN INTERACTIVE LAYOUT APPROACH -- NEED SOLUTIONS!!
(Note that distance(X1,X2) is distance in layout space, whereas attribute-distance(X1,X2) is distance in instance space.)

1. Interpret user movements as cluster, class, or distance constraints
- My proposal:
For each pair of user-moved points {X1,X2}:
if distance(X1,X2) < epsilon, impose SAME constraint
if distance(X1,X2) > delta, impose NOT-SAME constraint
else no constraint
- Your ideas and variations?

2. Use constraints to identify clusters, classes, or distance measure
- My proposal:
Compute the transitive closure of the SAME constraints, resulting in G groups
Set K = G+1 (one cluster for each group, plus a "miscellaneous" cluster)
Run COP-K-means (K-means, but with the modification that points are put into the nearest cluster that doesn't violate any constraints)
- Your ideas and variations?

3. Compute a new layout, using the cluster/class/distance information
- My proposal:
Create a dummy (invisible) cluster center Cj for each group, with layout location = average of all points that the user placed in that cluster
For each point Xi and each cluster center Cj,
If attribute-distance(Xi,Cj) < epsilon2, add invisible edge from Xi to Cj
Apply force-directed layout to the new graph, animating the result (i.e., showing the nodes smoothly moving to their new locations)
- Your ideas and variations?

WEEK 3 (6/20) : BASIC VISUALIZATION
JF/NL - JUNG-Prefuse connection
JF - Record positions of nodes moved
JF - Generate pairwise clustering constraints, using epsilon and delta parameters; identify number of clusters (k)
JF/NL - shape/color visualization mappings
NL - DMP dataset
NL - Design of synthetic data generation

WEEK 4(6/27) : IMPLEMENT CLUSTERING; SYNTHETIC DATA
JF - Implement COP-Kmeans using attributes only plus pairwise constraints
JF - Generate dummy "cluster center" nodes and attach to cluster members
NL - Draw dummy "cluster center" nodes and associated edges "invisibly" so they do not appear in the display (but are used for layout)
NL - Implement synthetic data generation
JF/NL/MdJ - Read and discuss Cohn et al. semi-supervised clustering paper

WEEK 5 (7/4) : CUSTOMIZE/TUNE LAYOUT/VISUALIZATION/CLUSTERING
JF - Cluster-sorting demo on toy data sets [Monday]
JF - (?) Implement Cohn et al. clustering method
NL - Refine visual mappings (color, shape, size of nodes; layout parameter settings) for the three data sets (courses, DMP, synthetic data)
NL - Begin developing "real" data set (Hollywood actors from IMDB; citeseer)

WEEK 6 (7/11) : PREIMINARY EVALUATION SETUP
- Read and discuss relational clustering paper

WEEK 7 (7/18) : RELATIONAL CLUSTERING, DATA SETS
JF - Debug overconstrained-cluster problem
JF - Implement convention for attribute naming according to type
JF - Implement PCK-Means / connection to Weka (with help from Eric)
JF - Implement relational clustering
NL - Implement graph-distance measure (using Prefuse's built-in functions where possible)
NL - Complete Oscar nominations data set
NL - Implement Adjusted Rand Index for cluster evaluation
NL - Get CVS working properly and check in all code written to date

WEEK 8 (7/25) : DATA COLLECTION/ANALYSIS, SCALABILITY, WRITING
JF/NL - Complete tasks from Week 7 :-)
NL - Write up a detailed description of the data set generator and Oscar nominations data that we can use for the paper
JF - Write up a detailed description of the clustering/layout method that we can use for the paper
NL - Investigate visualization methods to help with scalability (e.g., clustered subgraph display in Prefuse)

WEEK 9 (8/1) : DATA ANALYSIS, SCALABILITY, WRITING
- Design experiments
- Implement "simulated user" and experiment scripts
- Collect data
- Write paper sections

WEEK 10 (8/8) : DOCUMENTATION, WRITING
- Analyze experimental data and produce graphs
- Revise paper
- Document all code
- Final system cleanup


Java Application
(click the image for bigger resolution)

The time given did not allow the ability to create java applets for a preview on the web of the animation of the motion of graph nodes in a force directed layout which I created.

I created the CRA-W DMP dataset. To represent this dataset I used the source code "RadialGraphDemo.java" from the package "prefuse":
I created program "Randomly Syntetic Data Generation" that allows the input data from console to generate the randomly connected graph:

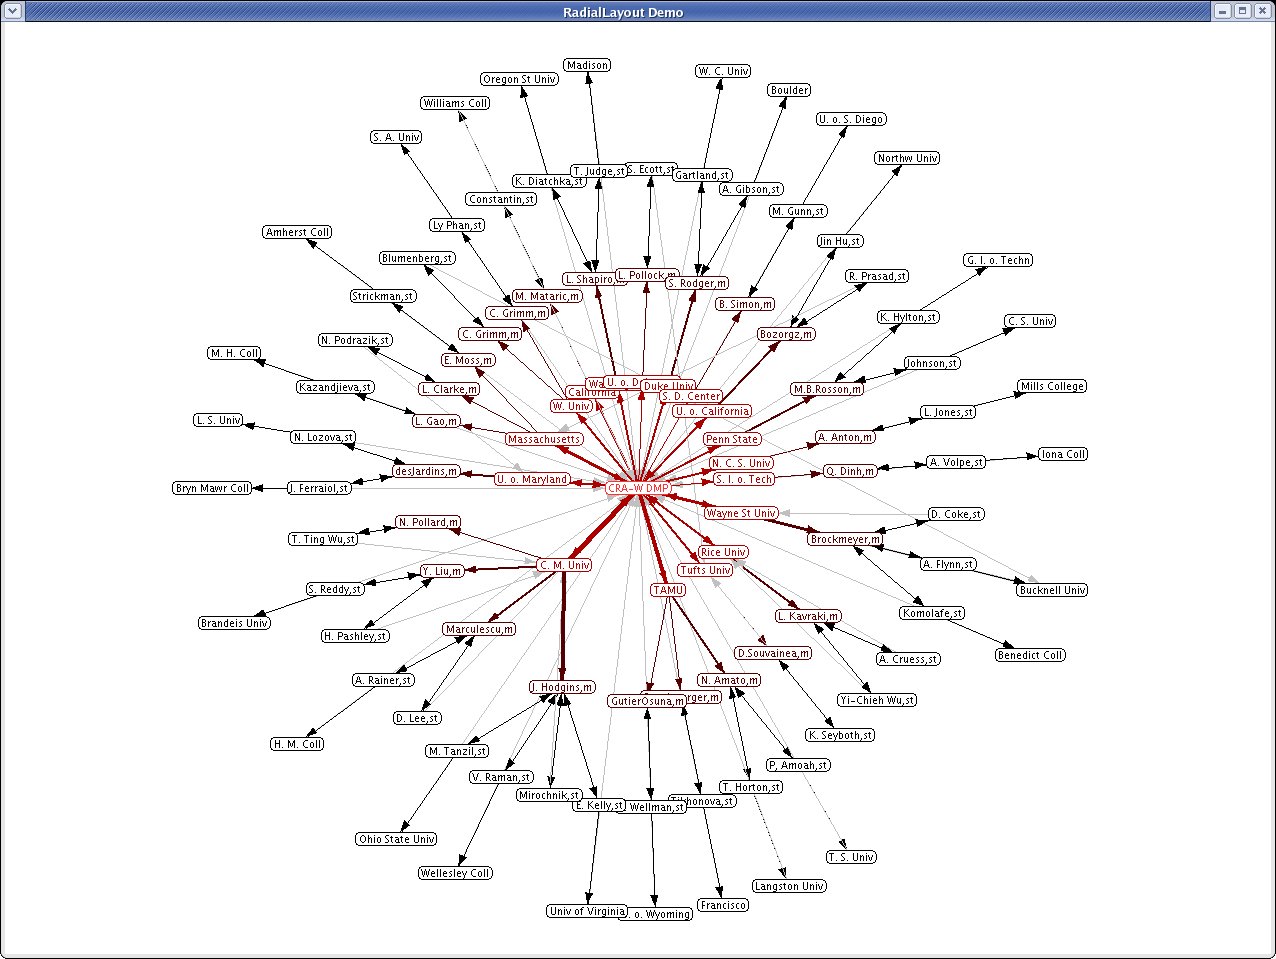
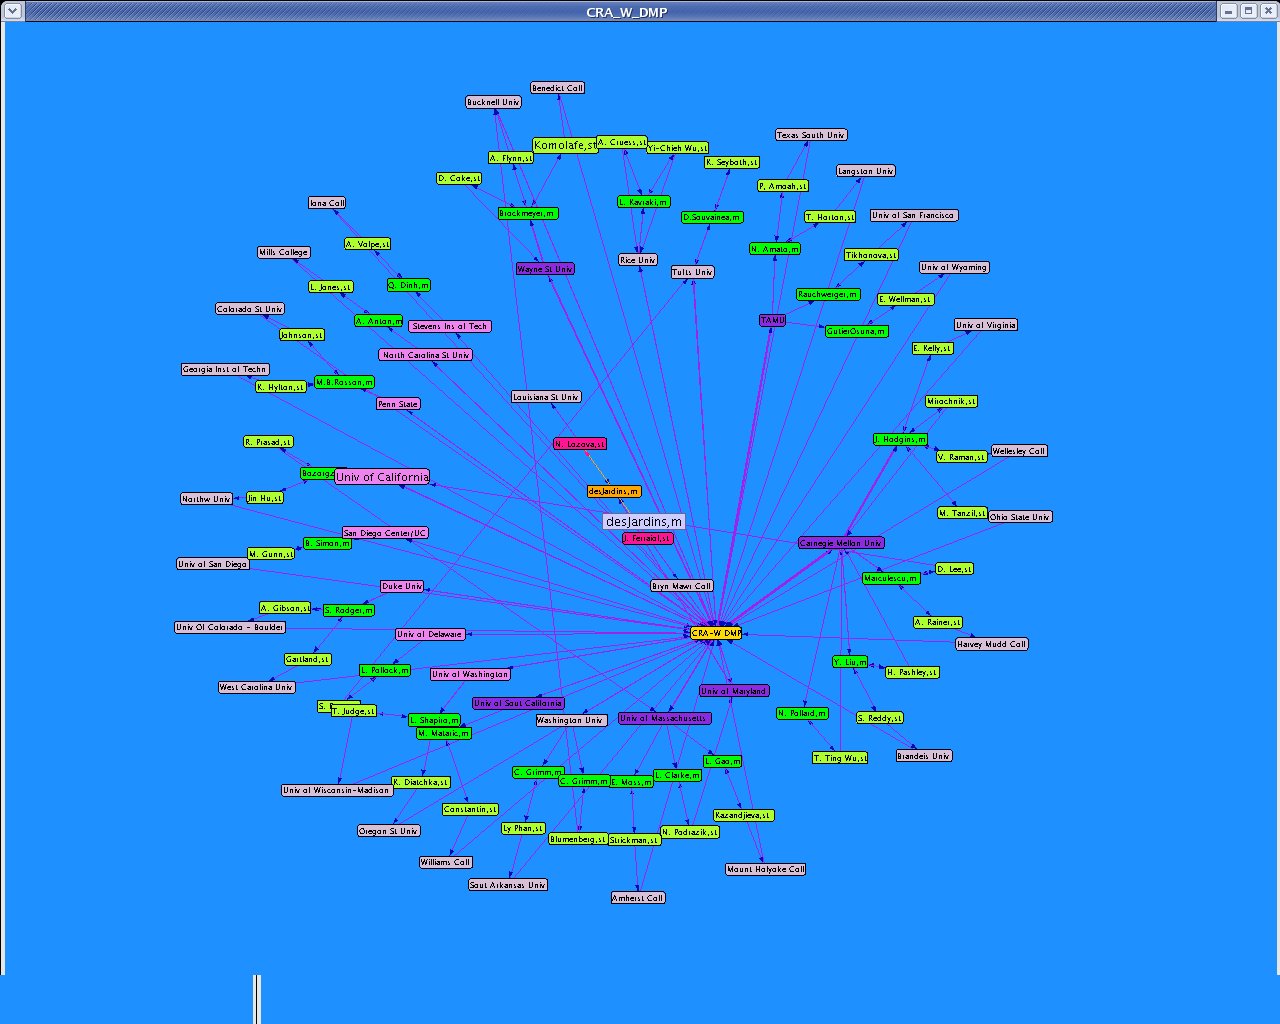
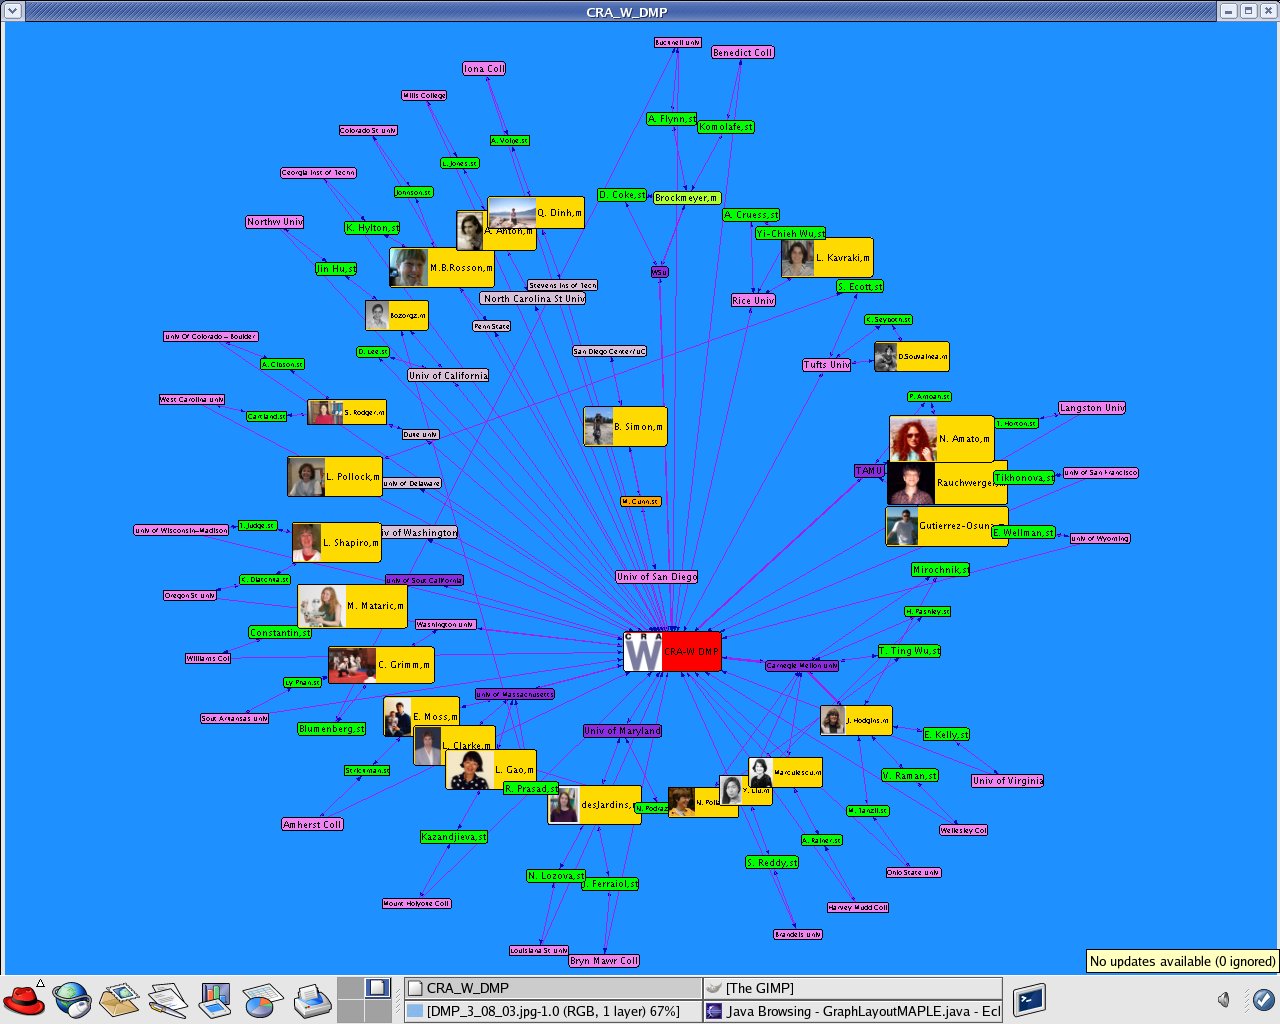
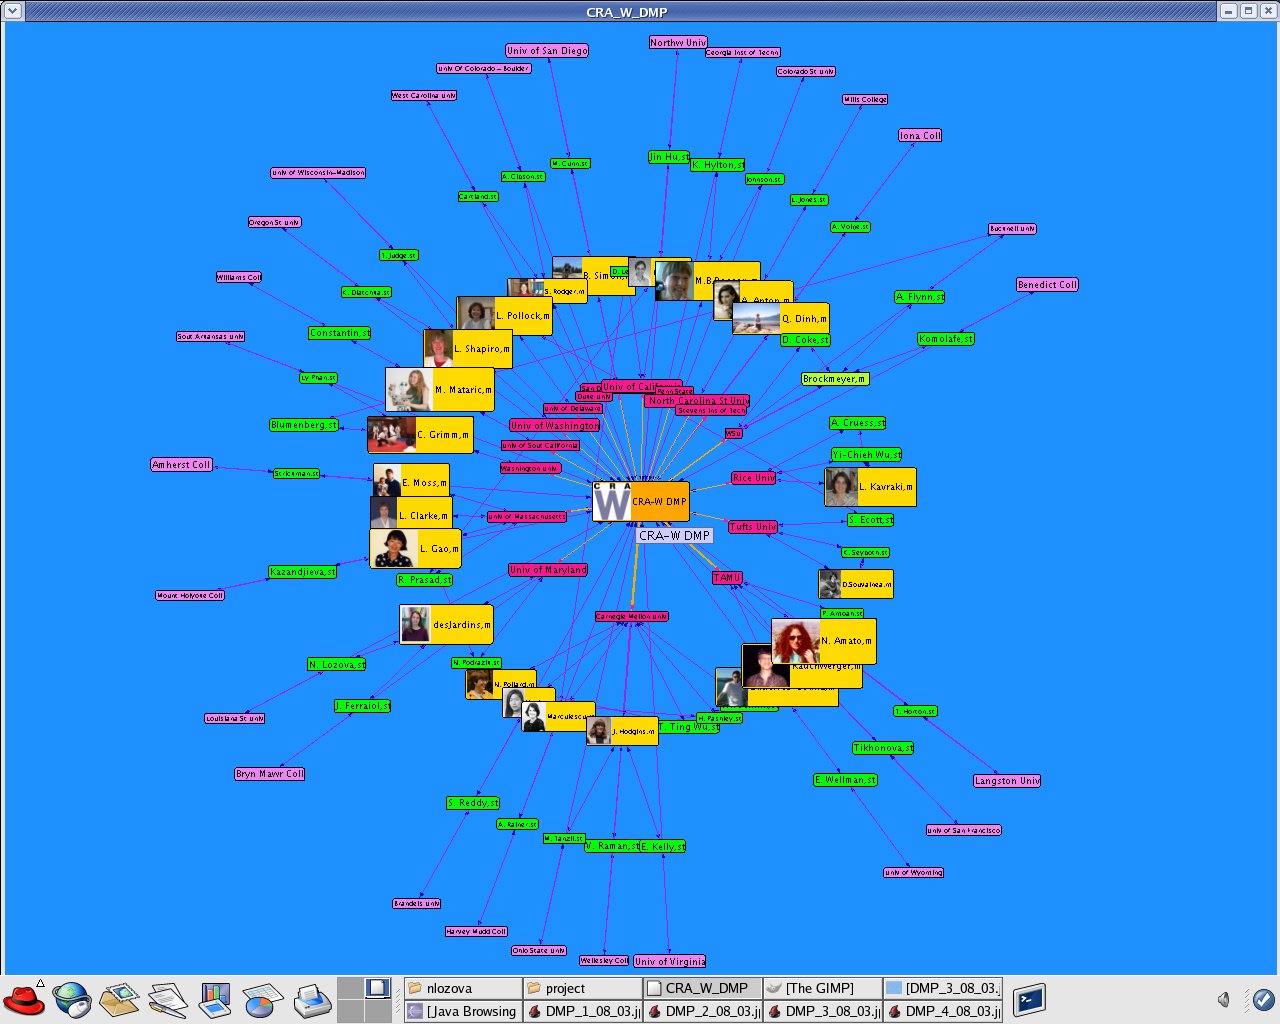
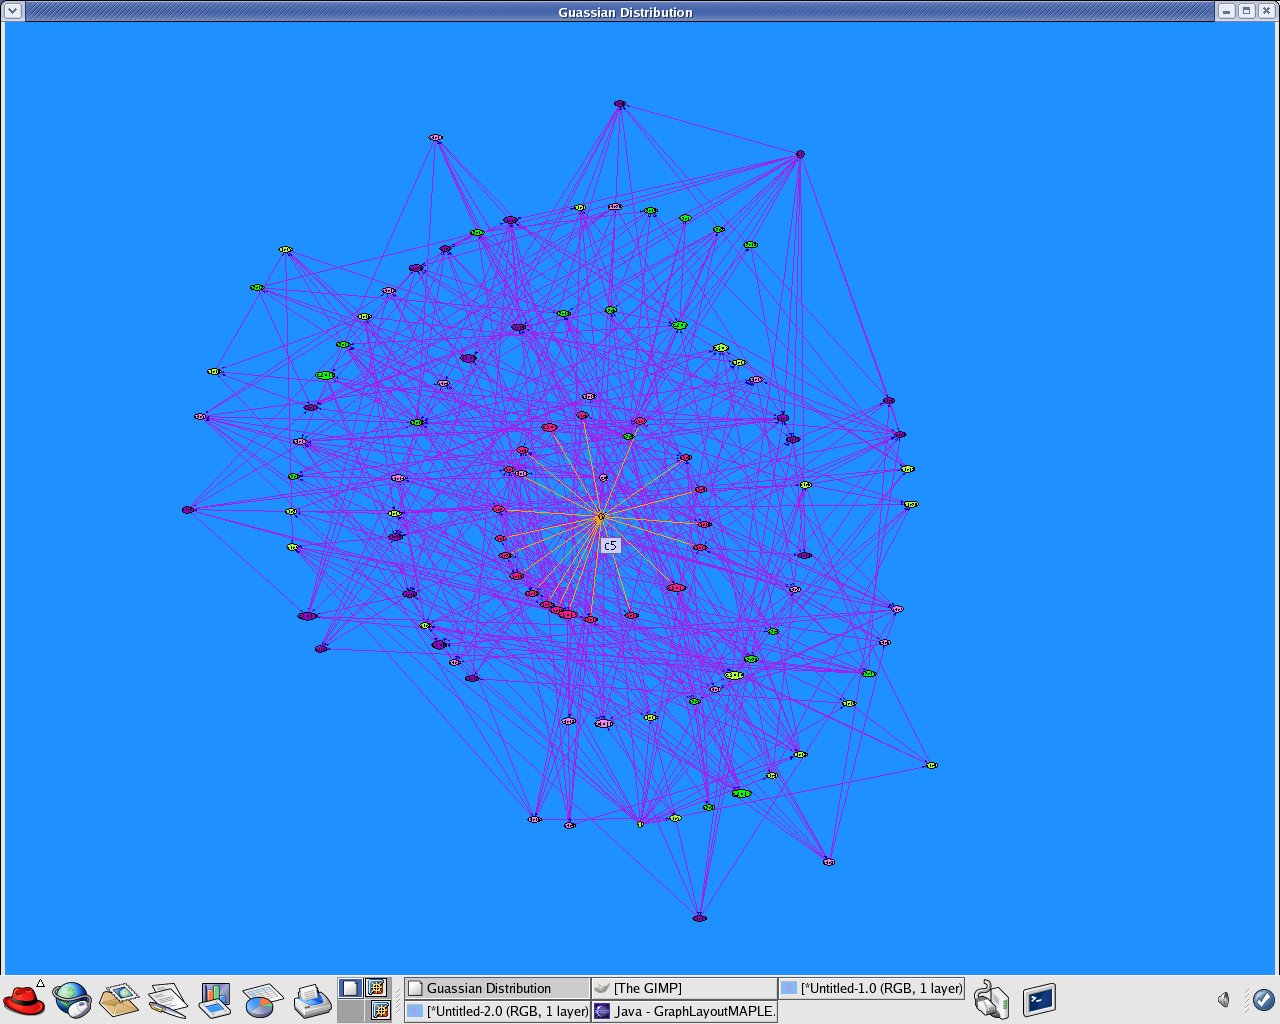
This picture represents the implementation of programs Syntetic Data Generation and Force - Directed Graph Layout
Implementation of the Force - Directed Graph Layout with CRA-W DMP dataset.:
Fig. 1
Fig. 2
Fig. 3


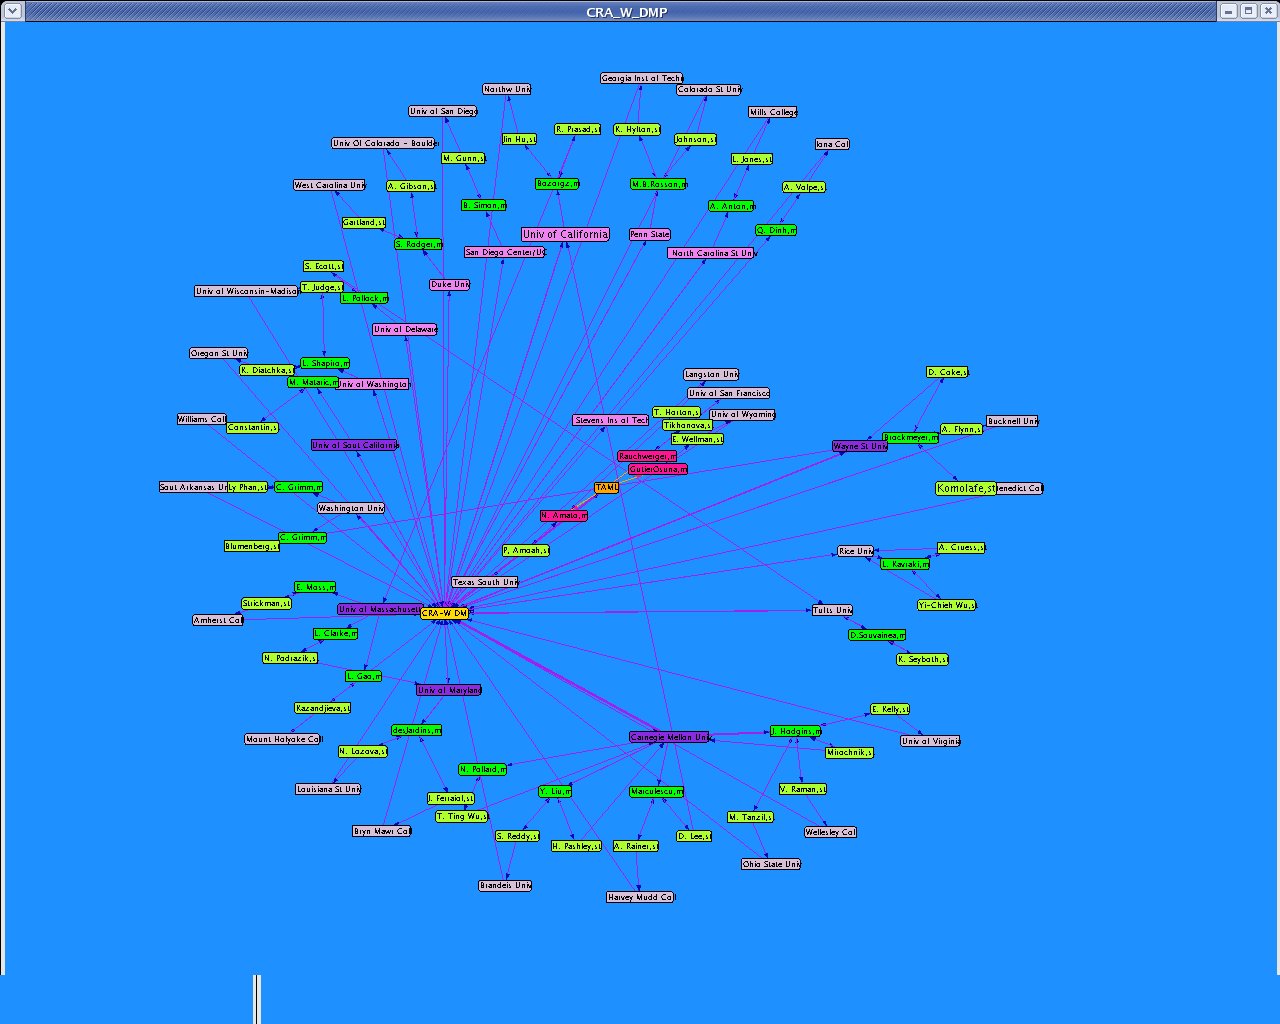
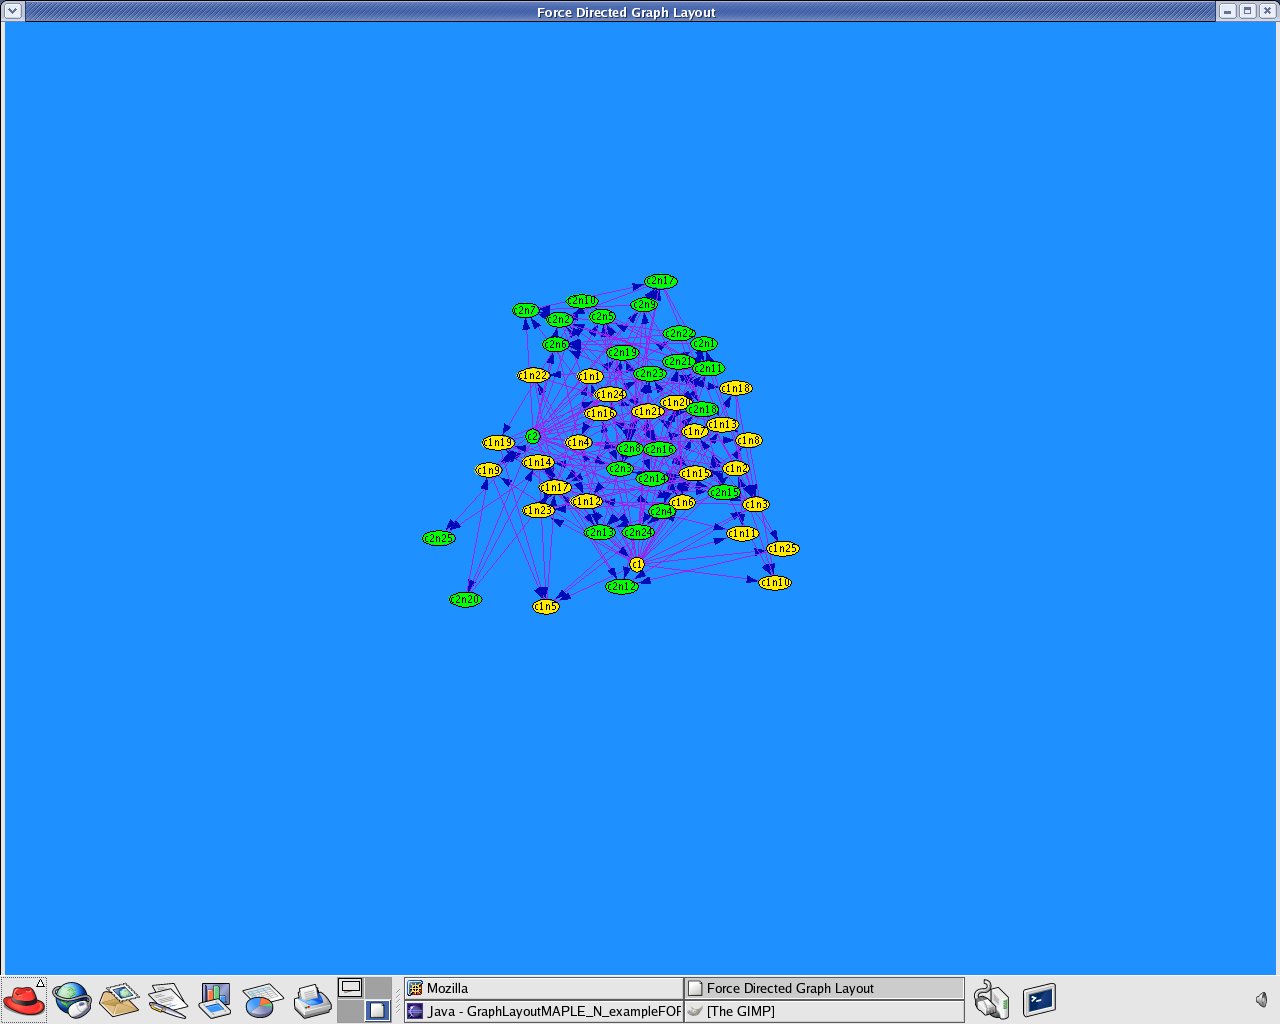
The following application was created after the development of my program GraphLaoyutN.java during fifth, sixth, and seventh week.

Fig. 4
Fig. 5
Fig. 6


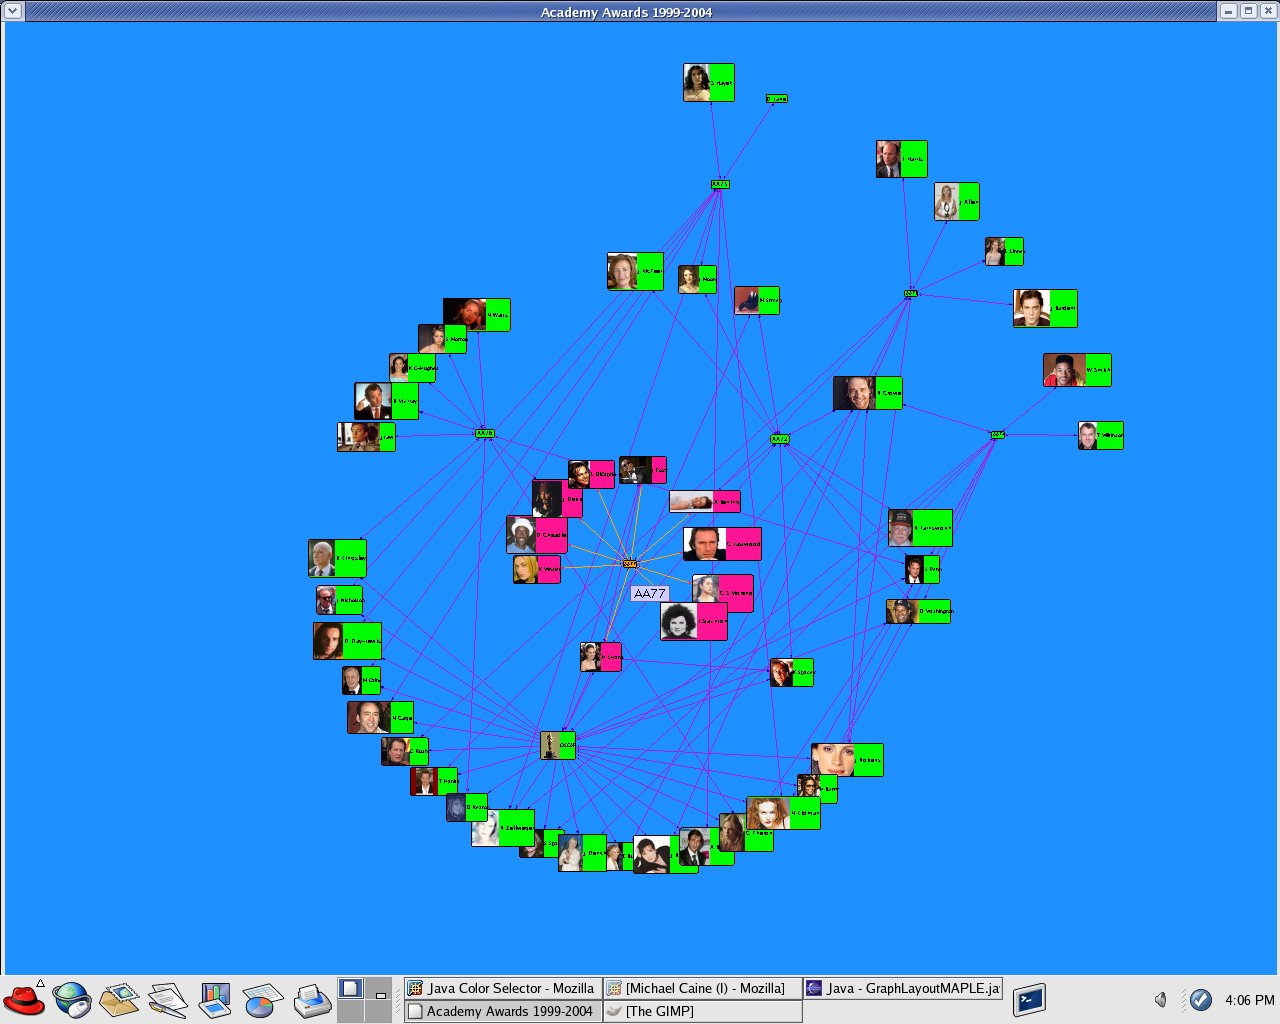
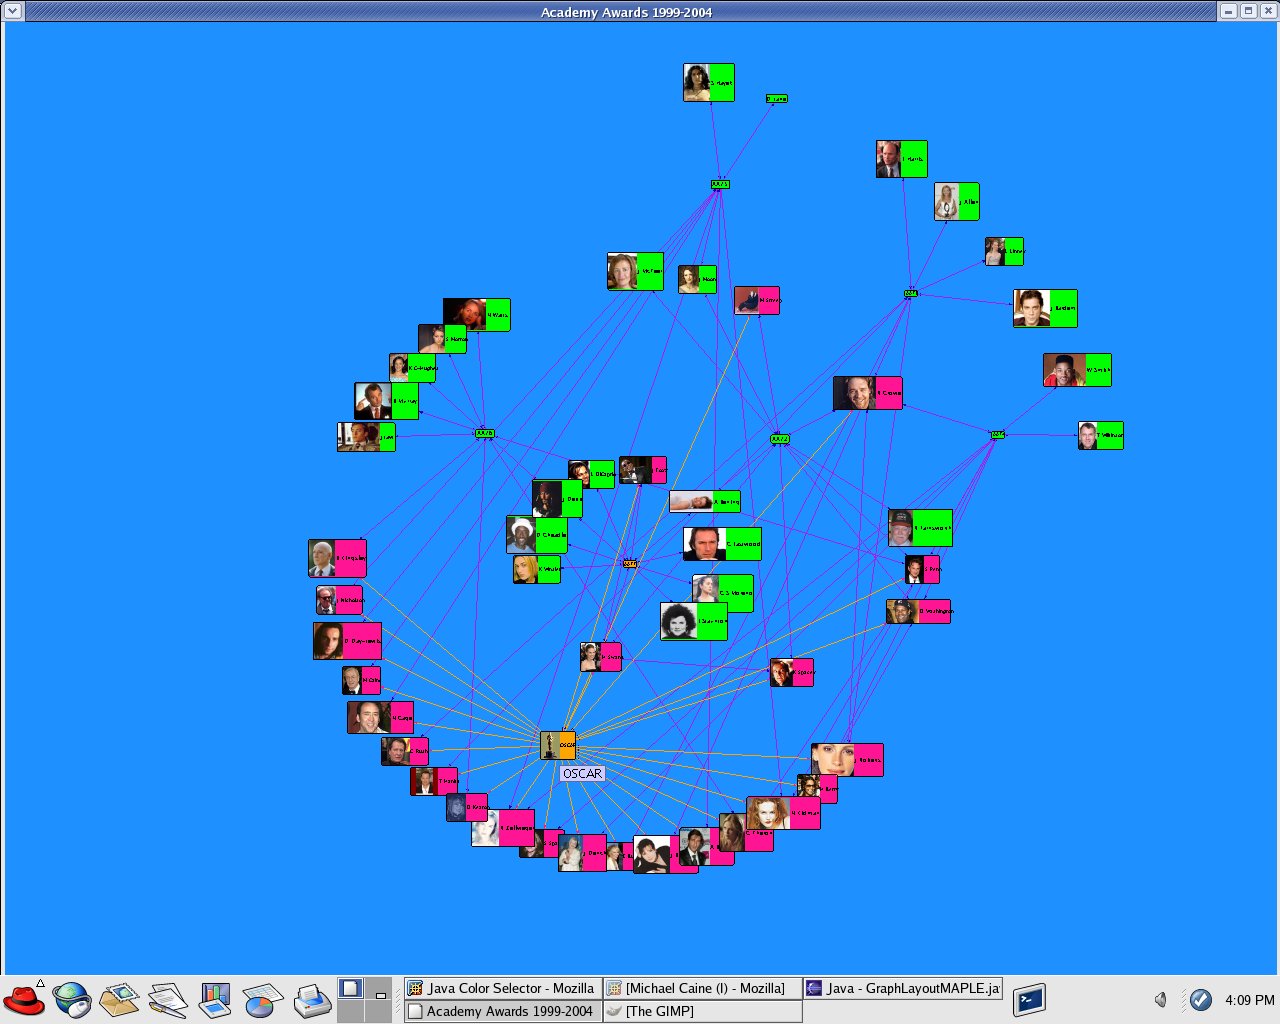
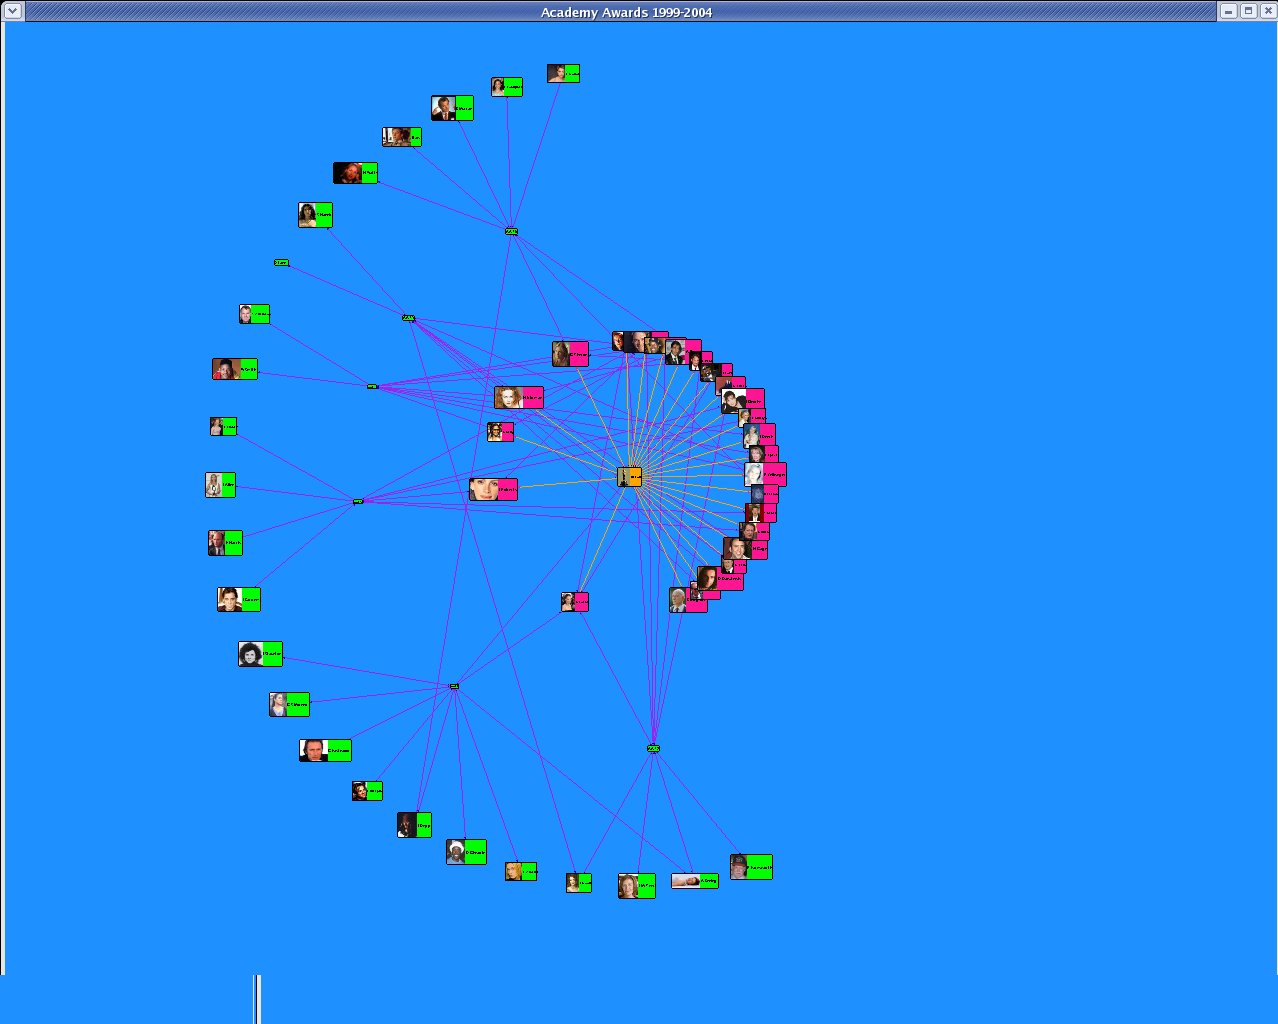
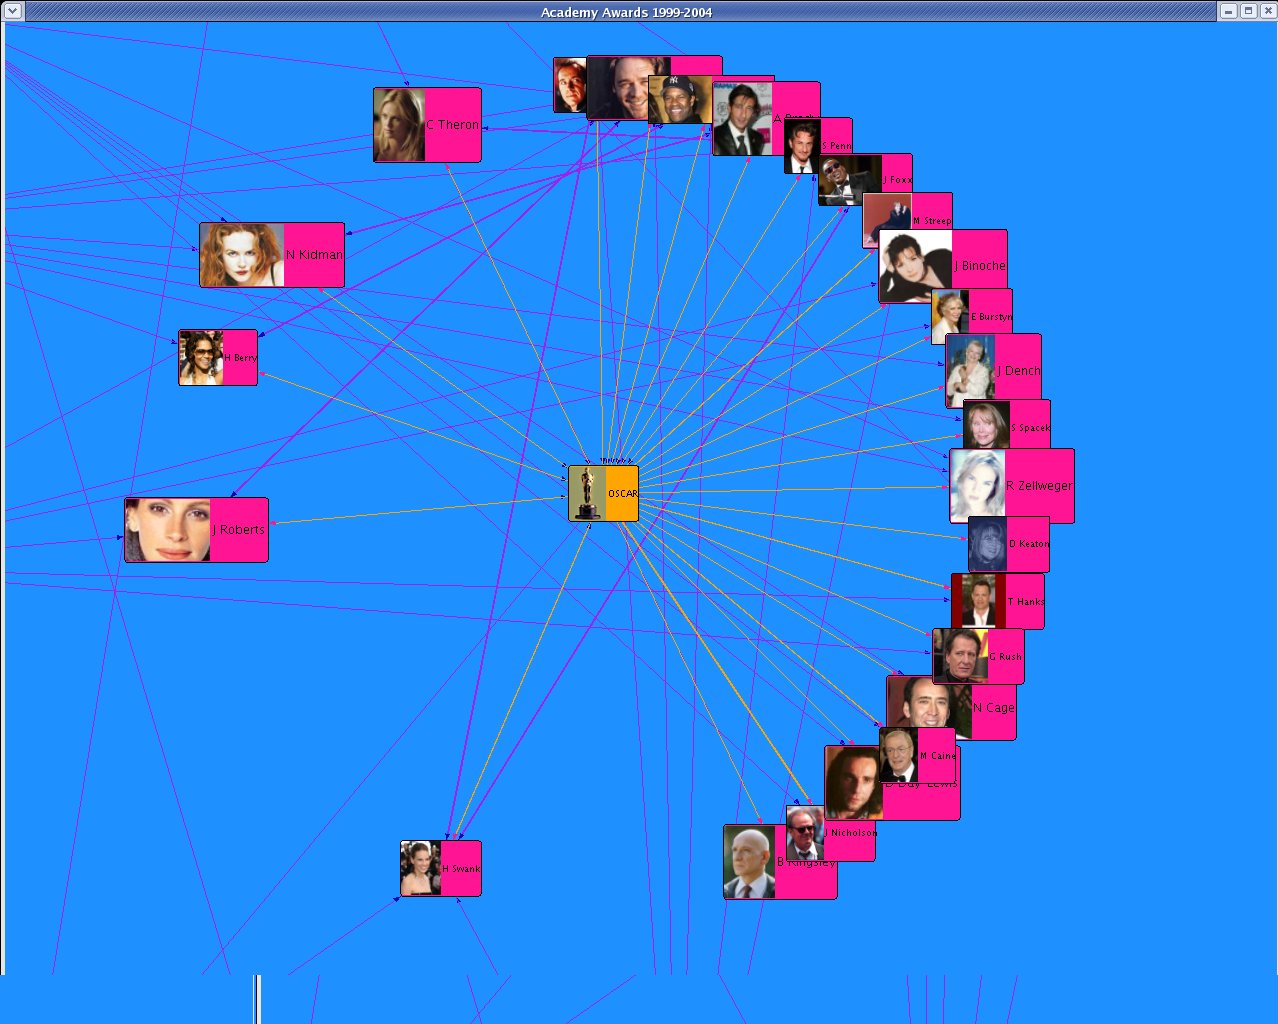
I created a new data set OSCAR_N that ran in my program GraphLayoutN.java. This dataset was based on "The Official Academy Awards Database" from http://awardsdatabase.oscars.org/ampas_awards/BasicSearchInput.jsp

Fig. 7
Fig. 8
Fig. 9
Fig. 10


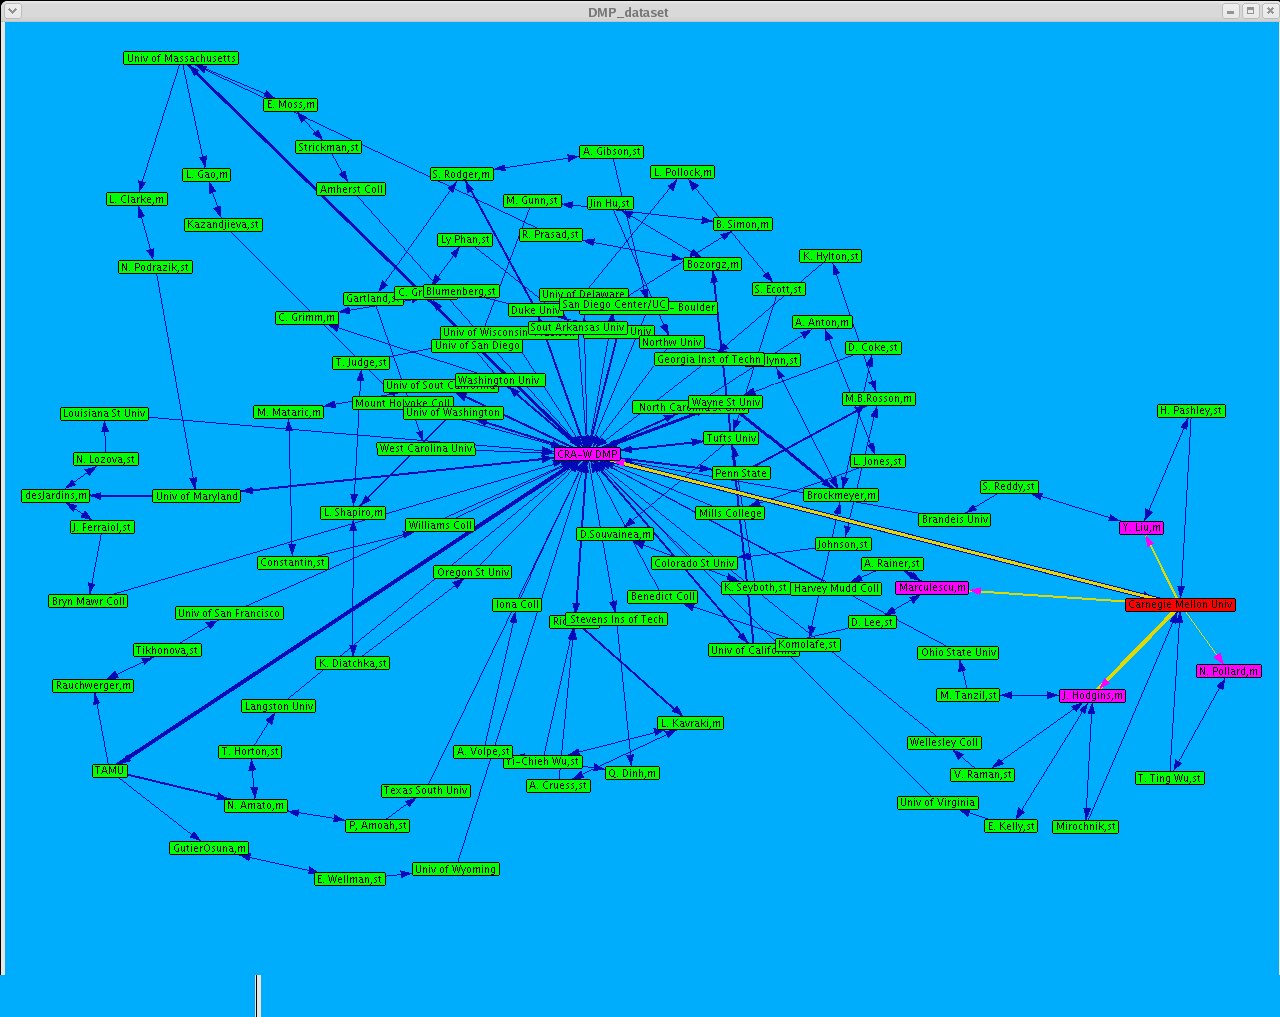
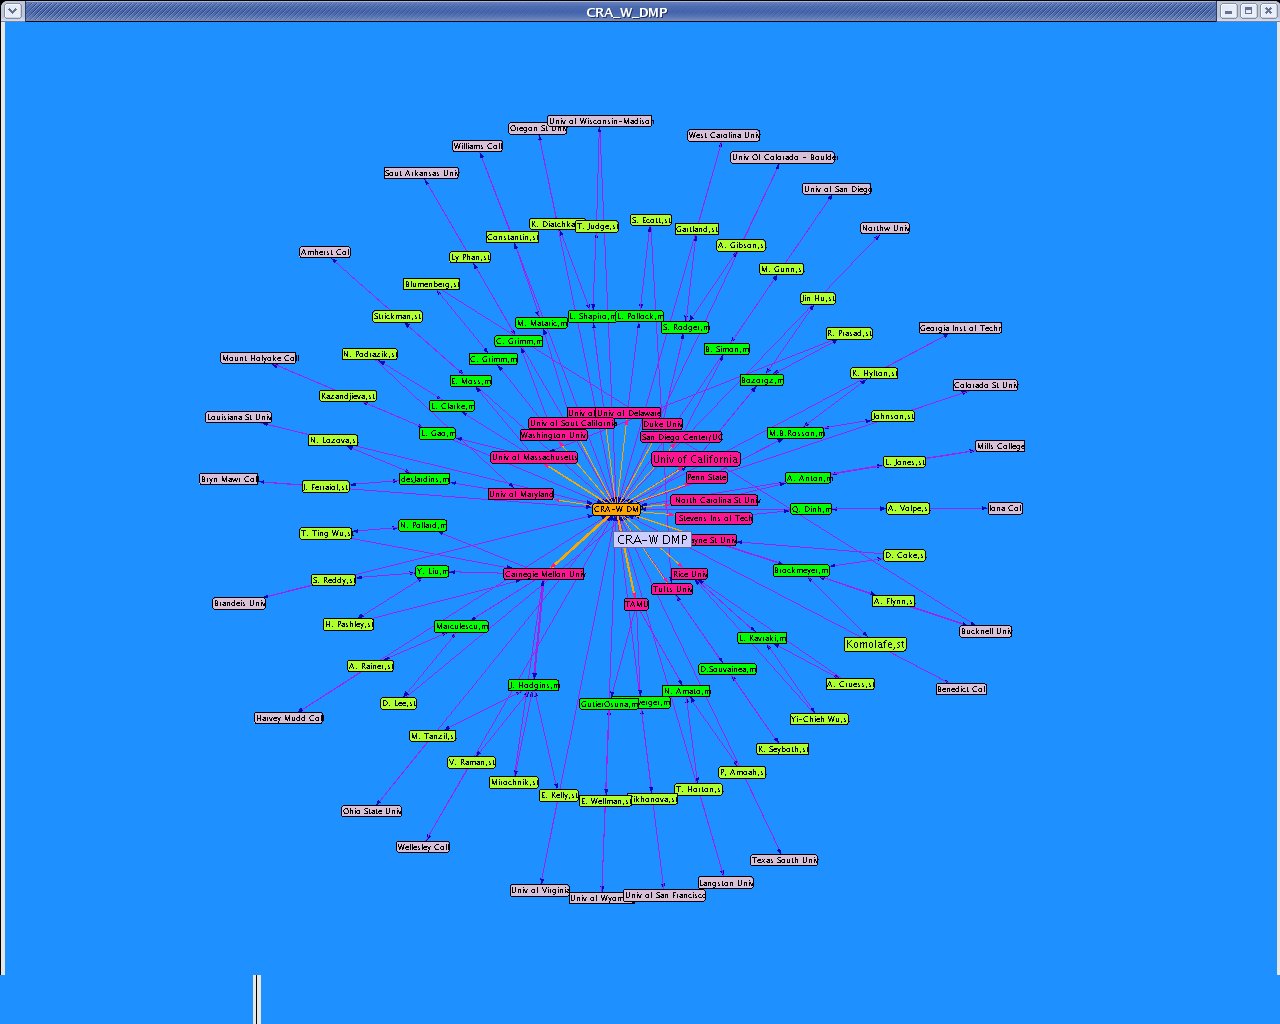
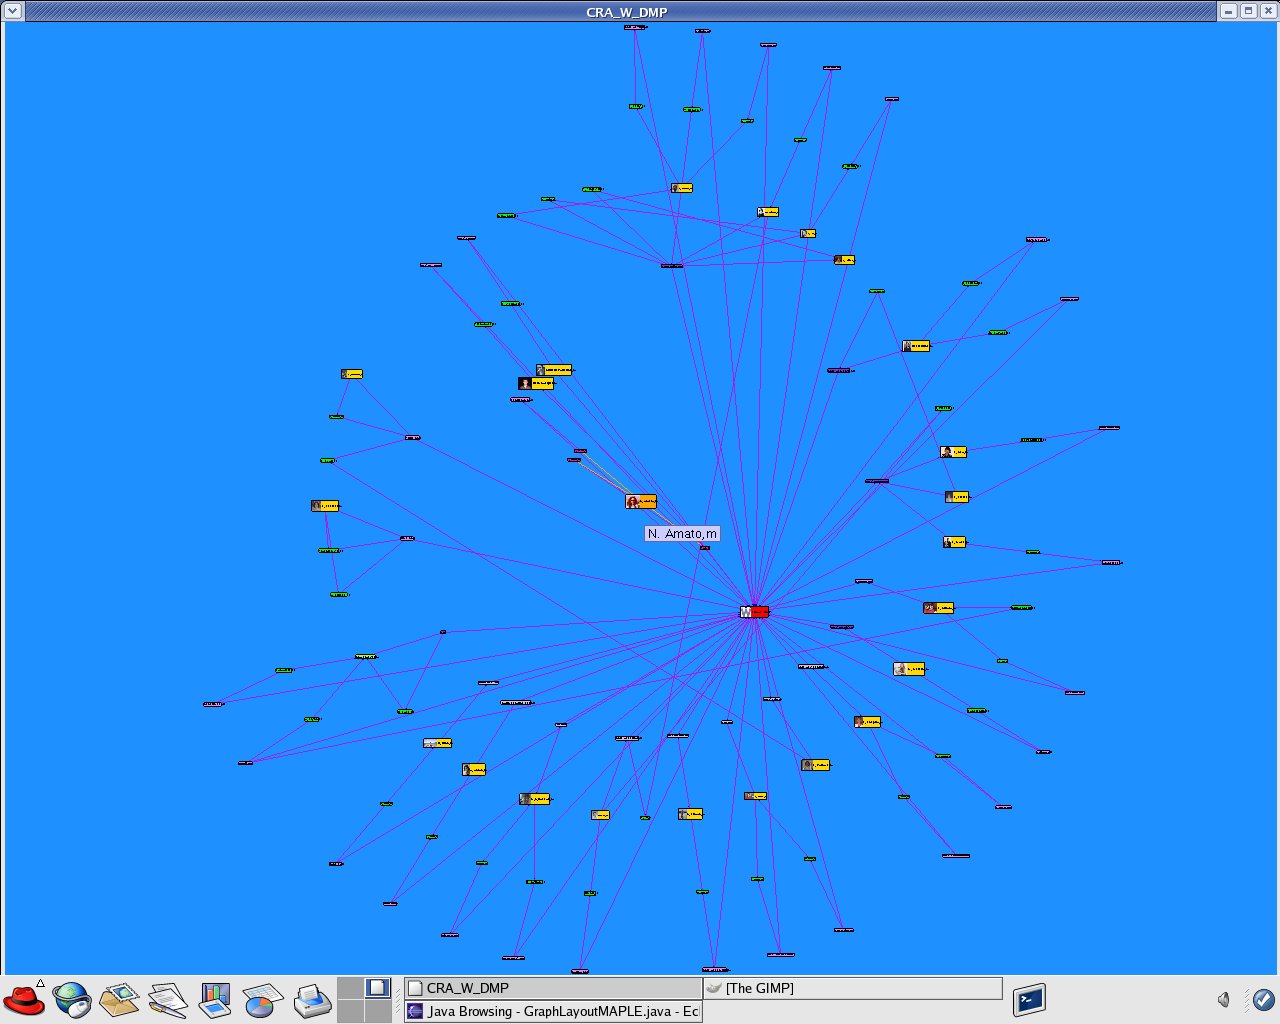
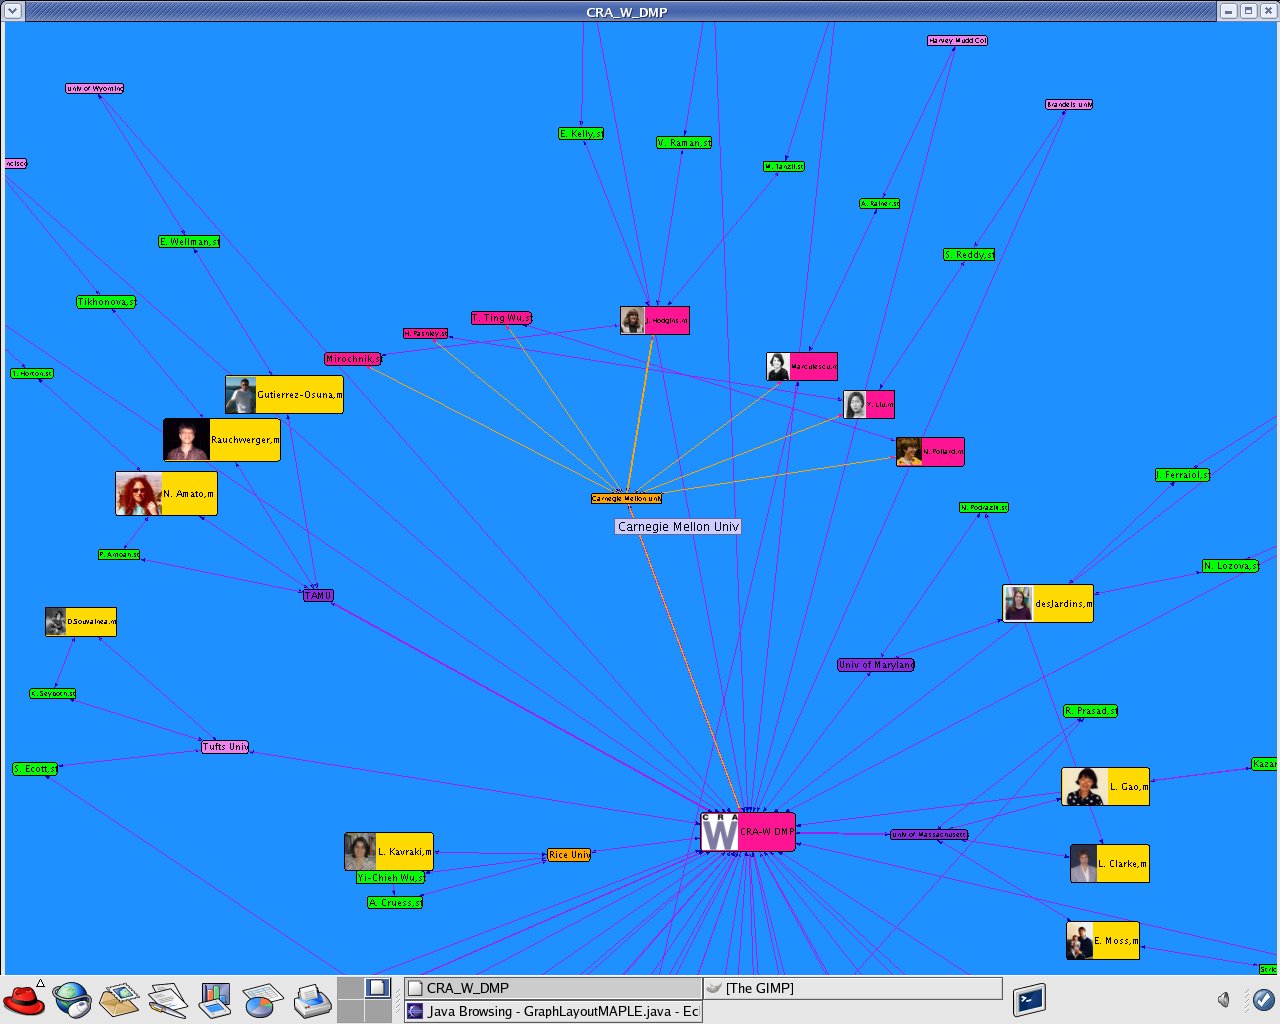
I updated the dataset "CRA_W_DMP_dataset_N.xml" using the data from the official site "Mentoring Undergraduate Women in Computing Research CRA-W Distributed Mentor Project (DMP) Summer 2005 Awards" http://www.cra.org/Activities/craw/dmp/awards/2005/2005.php and data from Academic Ranking of World Universities 2004/Top 500 World Universities from the following website http://ed.sjtu.edu.cn/rank/2004/top500list.htm

Fig. 11
Fig. 12
Fig. 13
Fig. 14


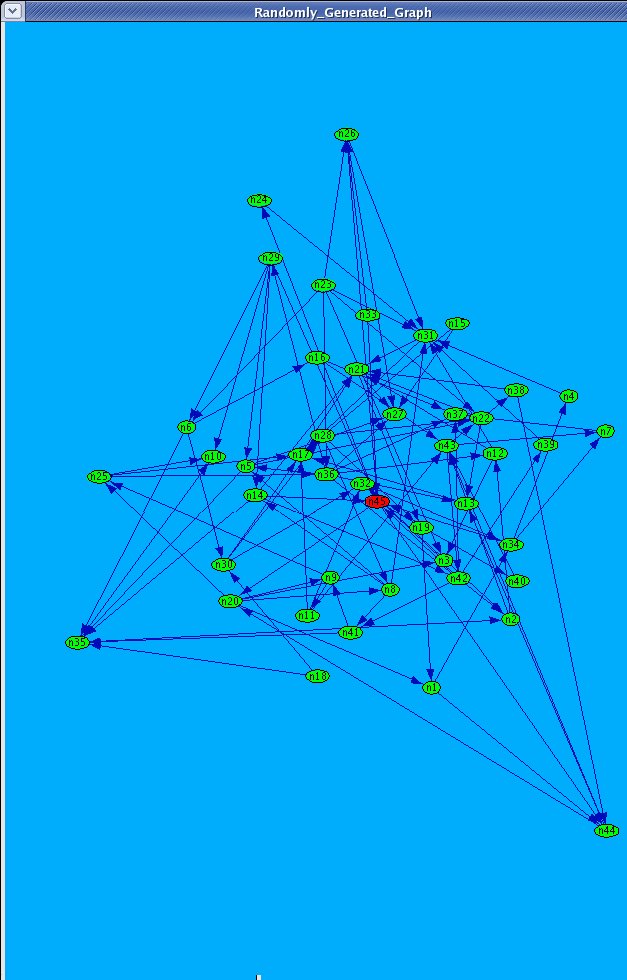
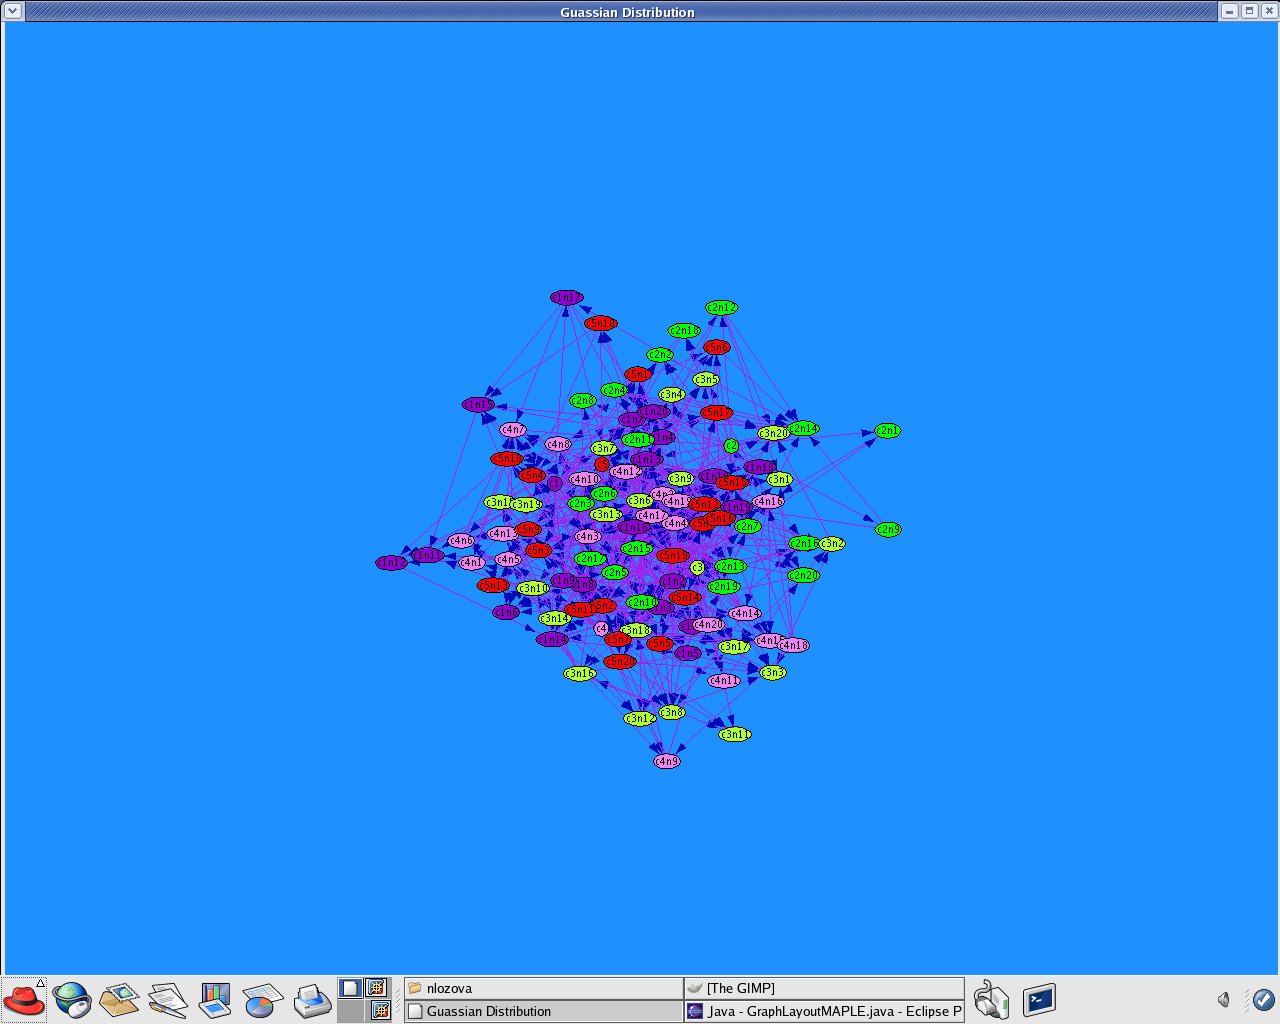
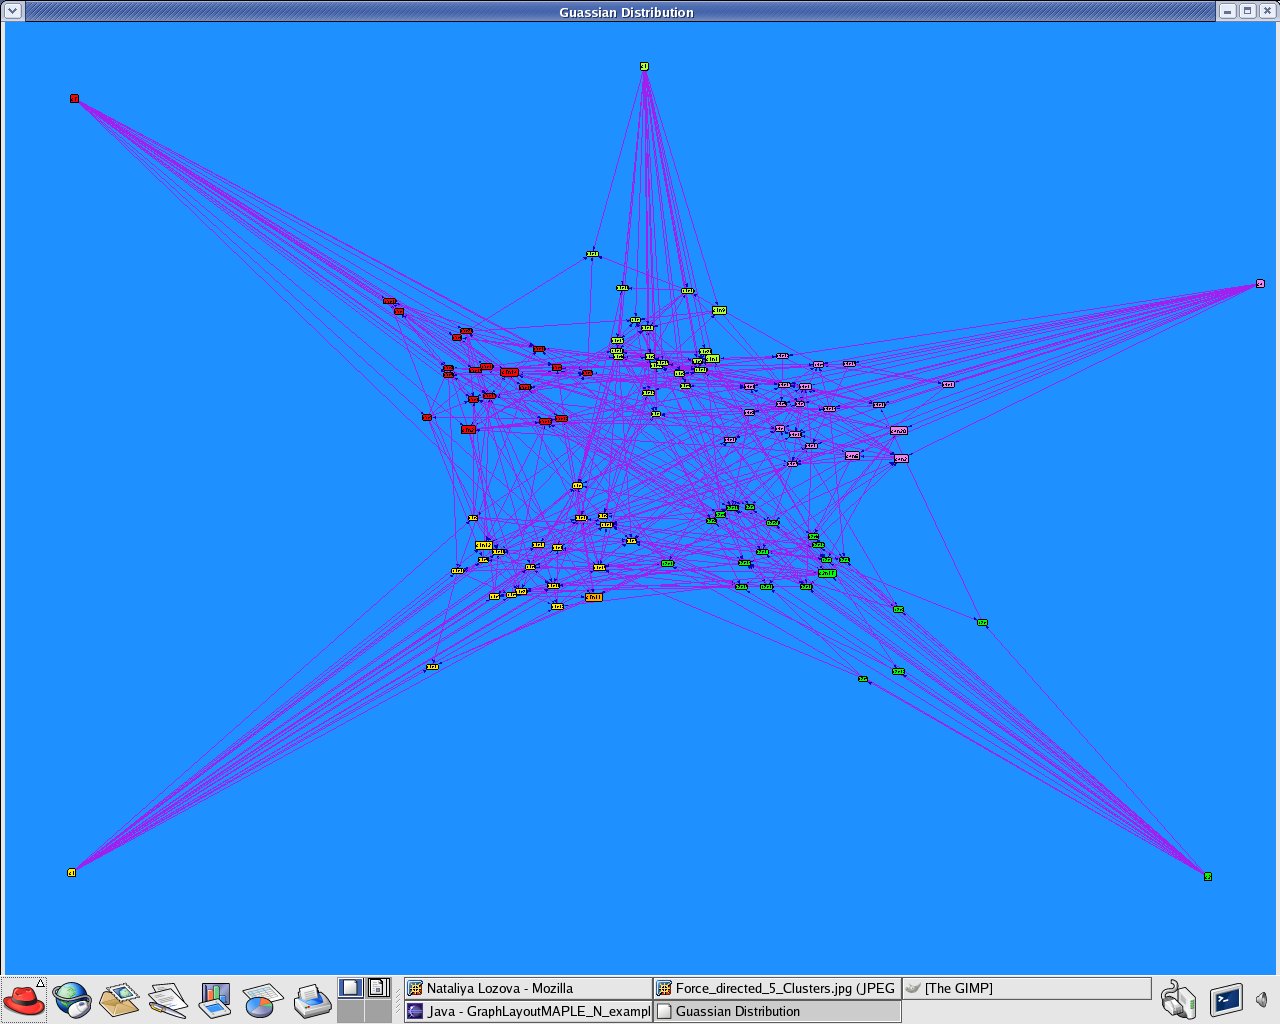
Manipulation with the created dataset, which I created during the last week of my internship, for Random clustering according to a multivariate Gaussian distribution to produce Structure-based clustering (using edges only)

Fig. 15
Fig. 16
Fig. 17


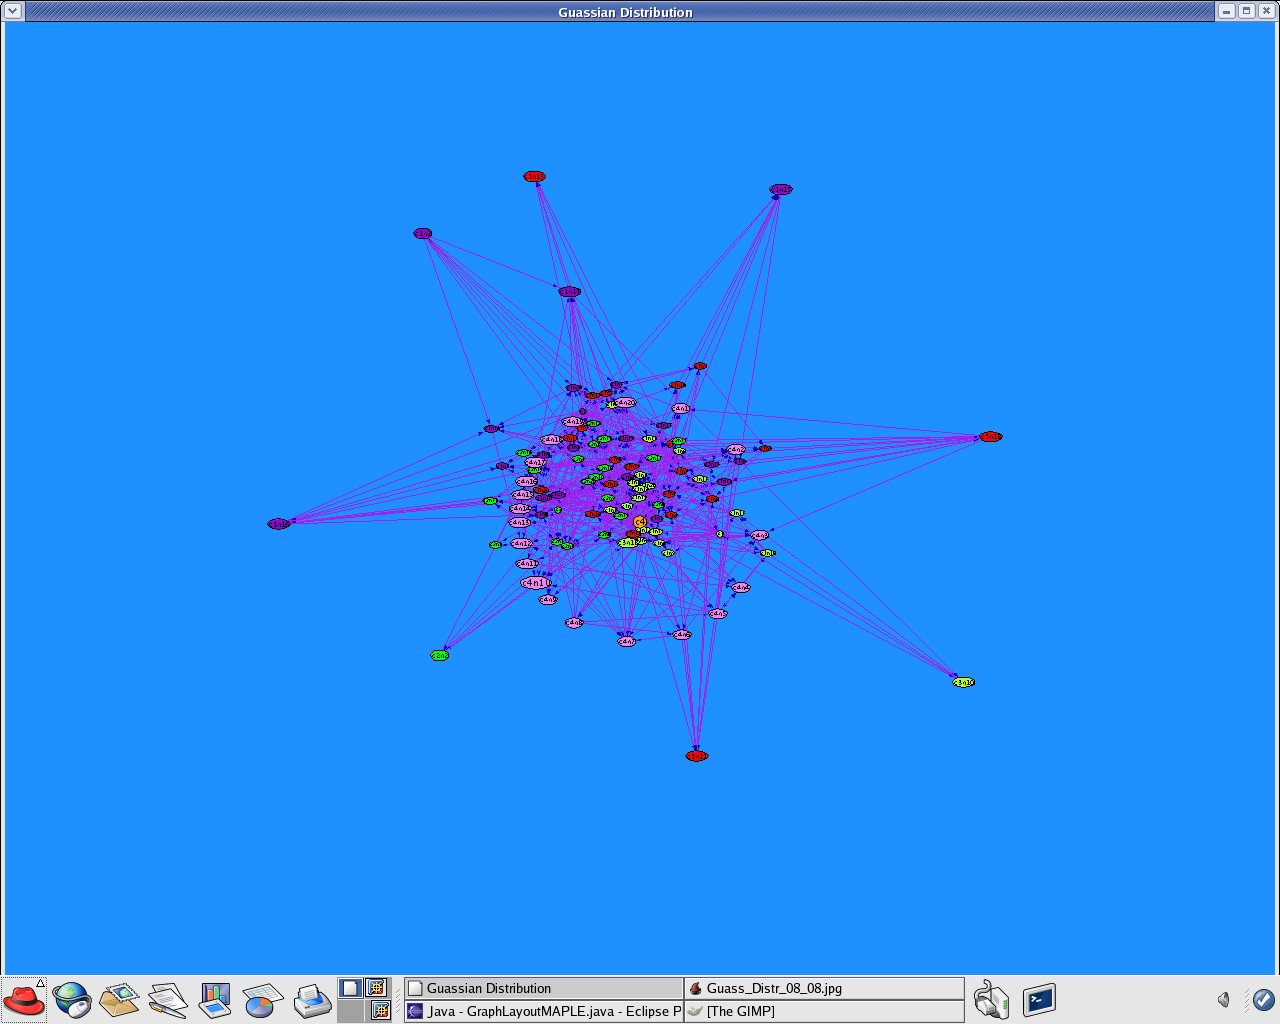
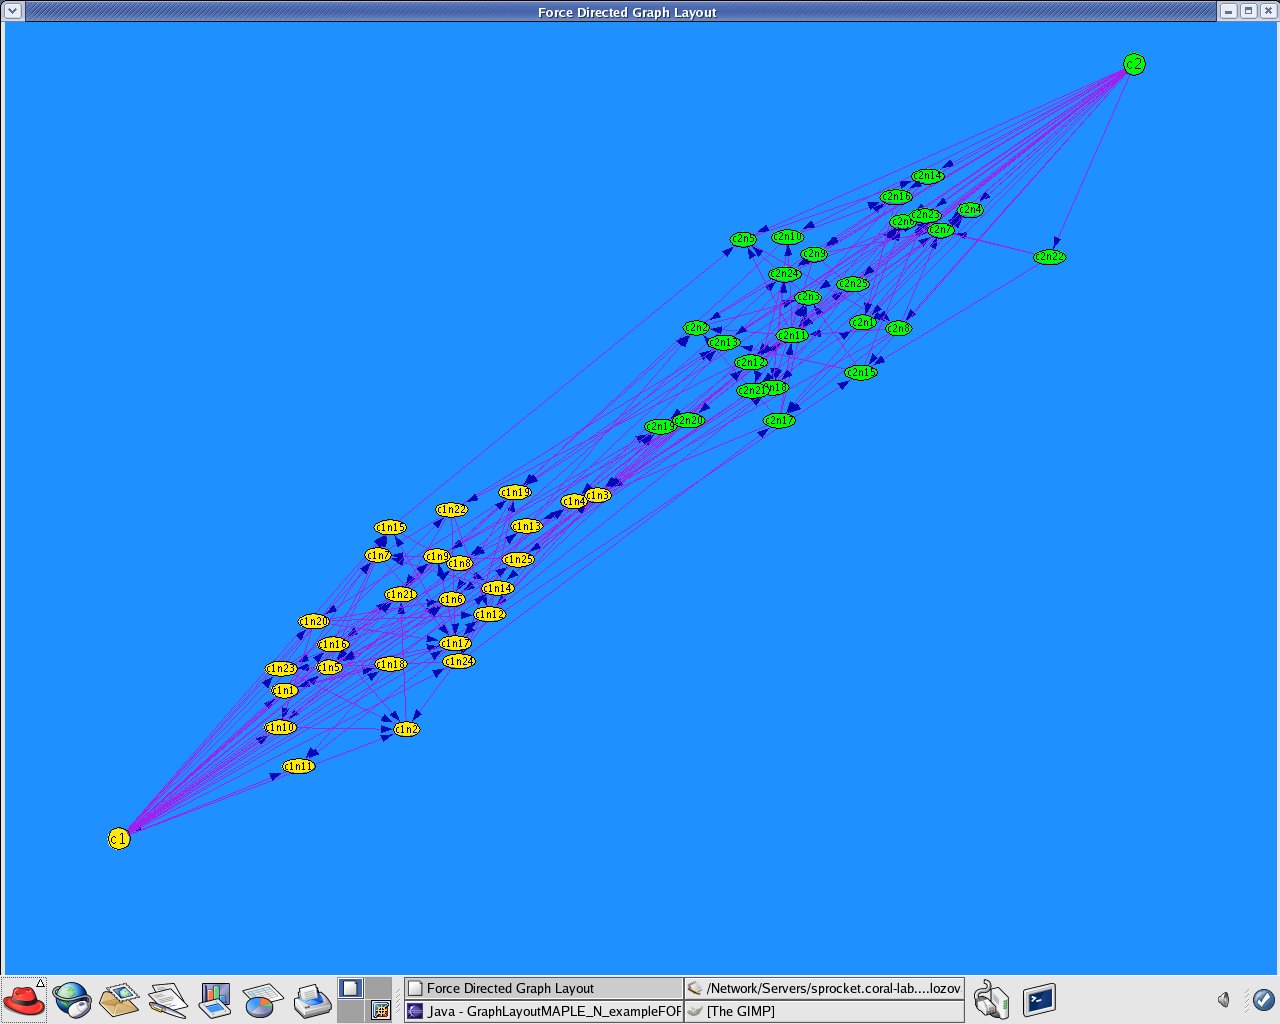
Applications that created by GraphLayoutMaple_N.java to produce Attribute-based clustering (using attributes only) with above mentioned Guassian distributed datasets.

Fig. 18
Fig. 19
Fig. 20


Project Definitions

All of the following definitions have been cited from the websites following the definitions.

Eclipse - is an open source software development project dedicated to providing a robust, full-featured, commercial-quality, industry platform for the development of highly integrated tools.
http://www.eclipse.org/eclipse/faq/eclipse-faq.html

The Eclipse Platform subproject provides the core frameworks and services upon which all plug-in extensions are created. It also provides the runtime in which plug-ins are loaded, integrated, and executed. The primary purpose of the Platform subproject is to enable other tool developers to easily build and deliver integrated tools.
http://www.eclipse.org/platform/index.html

Prefuse is a user interface toolkit for building highly interactive visualizations of structured and unstructured data. This includes any form of data that can be represented as a set of entities (or nodes) possibly connected by any number of relations (or edges).
Examples of data supported by prefuse include hierarchies (organization charts, taxonomies, file systems), networks (computer networks, social networks, web site linkage) and even non-connected collections of data (timelines, scatterplots). Using this toolkit, developers can create responsive, animated graphical interfaces for visualizing, exploring, and manipulating these various forms of data.
http://jean-philippe.leboeuf.name/notebook/archives/000315.html

JUNG ? the Java Universal Network/Graph Framework - is a software library that provides a common and extendible language for the modeling, analysis, and visualization of data that can be represented as a graph or network. It is written in Java, which allows JUNG-based applications to make use of the extensive built-in capabilities of the Java API, as well as those of other existing third-party Java libraries. The JUNG architecture is designed to support a variety of representations of entities and their relations, such as directed and undirected graphs, multi-modal graphs, graphs with parallel edges, and hypergraphs. It provides a mechanism for annotating graphs, entities, and relations with metadata. This facilitates the creation of analytic tools for complex data sets that can examine the relations between entities as well as the metadata attached to each entity and relation.
http://jung.sourceforge.net/

Touch Graph provides a hands-on way to visualize networks of interrelated information. Networks are rendered as interactive graphs, which lend themselves to a variety of transformations. By engaging their visual image, a user is able to navigate through large networks, and to explore different ways of arranging the network?s components on screen. Extremely cool google and amazon apps!
http://www.informationlab.org/index.php?p=81

XML - Extensible Markup Language is a simple, very flexible text format derived from SGML (ISO 8879). Originally designed to meet the challenges of large-scale electronic publishing, XML is also playing an increasingly important role in the exchange of a wide variety of data on the Web and elsewhere.
http://www.w3.org/XML

Difference between XML and HTML:
XML was designed to describe data and to focus on what data is.
HTML was designed to display data and to focus on how data looks.

What is XML?
XML stands for EXtensible Markup Language
XML is a markup language much like HTML
XML was designed to describe data
XML tags are not predefined. You must define your own tags
XML uses a Document Type Definition (DTD) or an XML Schema to describe the data
XML with a DTD or XML Schema is designed to be self-descriptive
XML is a W3C Recommendation
http://www.w3schools.com/xml/xml_whatis.asp

Data Mining is an analytic process designed to explore data (usually large amounts of data - typically business or market related) in search of consistent patterns and/or systematic relationships between variables, and then to validate the findings by applying the detected patterns to new subsets of data. The ultimate goal of data mining is prediction - and predictive data mining is the most common type of data mining and one that has the most direct business applications. The process of data mining consists of three stages: (1) the initial exploration, (2) model building or pattern identification with validation/verification, and (3) deployment (i.e., the application of the model to new data in order to generate predictions).
http://www.statsoft.com/textbook/stdatmin.html

Structural visualization uses program and data structures to generate relevant geometrical information for graphic substrates. An important problem related to this kind of visualization is that conceptual information about data can only indirectly be derived (e.g. from naming of identifiers). A very common approach to structural visualization is to guide the visualization process by underlying programming styles or computational models.
http://www.cs.concordia.ca/~haarslev/publications/jvlc92/node2.html

Cluster is a group of compounds which are related by structural or behavioral properties. Organizing a set of compounds into clusters is often used in assessing the diversity of those compounds, or in developing SAR (structure-activity relationship) models.
http://www.combichemistry.com/glossary_c.html

cluster analysis (first used by Tryon, 1939) encompasses a number of different algorithms and methods for grouping objects of similar kind into respective categories. A general question facing researchers in many areas of inquiry is how to organize observed data into meaningful structures, that is, to develop taxonomies. In other words cluster analysis is an exploratory data analysis tool which aims at sorting different objects into groups in a way that the degree of association between two objects is maximal if they belong to the same group and minimal otherwise.
http://www.statsoft.com/textbook/stcluan.html

k-means clustering - to reiterate, the classic k-Means algorithm was popularized and refined by Hartigan (1975; see also Hartigan and Wong, 1978). The basic operation of that algorithm is relatively simple: Given a fixed number of (desired or hypothesized) k clusters, assign observations to those clusters so that the means across clusters (for all variables) are as different from each other as possible.
General Logic: Suppose that you already have hypotheses concerning the number of clusters in your cases or variables. You may want to "tell" the computer to form exactly 3 clusters that are to be as distinct as possible. This is the type of research question that can be addressed by the k- means clustering algorithm. In general, the k-means method will produce exactly k different clusters of greatest possible distinction. It should be mentioned that the best number of clusters k leading to the greatest separation (distance) is not known as a priori and must be computed from the data.

Similarities are a set of rules that serve as criteria for grouping or separating items. These distances (similarities) can be based on a single dimension or multiple dimensions, with each dimension representing a rule or condition for grouping objects.

Unweighted pair-group centroid - in this method, the distance between two clusters is determined as the difference between centroids..
http://www.combichemistry.com/glossary_c.html

Graph Drawing consists in finding a drawing of a given graph that is visually pleasant, based on some aesthetic criteria.
http://www.luchemos.org.ar/rodrigo/tesis/regions.htm

Graph Drawing is the decision problem of arranging a helpful drawing of a graph. It usually involves allocating geometric positions to vertices and (if edges need not be straight) allocating paths to edges. 'Helpfulness' seems to come down to satisfying preferences, notably for drawings with minimal edge crossings, and drawings that reveal similarities of structure, especially symmetry.
http://www.soi.city.ac.uk/~dcd/ig1/week6/l12.htm

Layout graph - graphs are abstract entities, sets of nodes connected by edges which cannot be "seen" unless one draws them. If a graph is drawn using a layout which reflects its structure, it can visualize relationships between objects in an intuitive way.
  • Since graphs can be used in many ways, different application domains usually require different layouts of graphs. The optimal graph layout as such does not exist.
  • Most application domains use only specific types of graphs, whose special properties may help define a good layout.
  • Often, graphs are composed of subgraphs which play different semantic roles. If this information is made available, it can help compute a layout which emphasizes the semantics of a graph.

http://www.cs.umu.se/~drewes/teaching/topics.html

Force-directed methods , which are among the most commonly used algorithms for graph drawing, usually try to satisfy two criteria: uniform edge length and uniform vertex distribution.
http://www.luchemos.org.ar/rodrigo/tesis/regions.htm

Force-Directed Algorithm , meaning that vertex layout is determined by the forces pulling vertices together and pushing them apart. Attractive forces occur between adjacent vertices only, whereas repulsive forces occur between every pair of vertices. Each iteration computes the sum of the forces on each vertex, then moves the vertices to their new positions.
http://boost-consulting.com/boost/libs/graph/doc/fruchterman_reingold.html

Requirenment to simple animation in Force-Directed Layout
1. For each vertex, the sum of the design force vectors on it is found;
2. Each vertex is then moved by an amount proportional to that vector sum;
3. If displayed graphically, update the display to show the new layout.
http://www.soi.city.ac.uk/~dcd/ig1/week6/l12.htm

Force-directed Graph Drawing Lets us design artificial systems of forces corresponding to our layout preferences. For example: repulsions between elements tend to spread them out evenly in available space or springy edges with a distinct preferred length tend to promote good alignments.
http://www.soi.city.ac.uk/~dcd/ig1/week6/l12.htm

Spring forces in Force-Directed Layout?
A spring embedder is simulated. The nodes of a graph are regarded as electrically charged particles that repel one another, the edges being regarded as springs connecting the particles. Particles that are far away from one another attract each another by spring forces, particles that are too close repel one another.
http://www.aisee.com/manual/windows/node91.html#sssec-force-directed