Final Report
What You See Is What You Test(WYSIWYT)
PROBLEMS:
- Spreadsheets are among the most common form of software used by the end users, the most prevalent type of “programmers” (Figure 1).
- Despite the perceived simplicity, spreadsheets created by end-users frequently contain errors, and the resulting impact is sometimes detrimental given the widespread use of spreadsheets.
- End users are over confident about their programs.
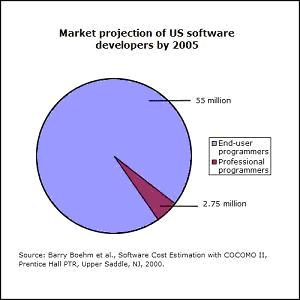
Figure 1
GOALS:
-
To create systems that will help the end users improve the dependability of their “programs” (spreadsheets) as they work.
-
To develop devices that “fit” end users’ environments, which are incremental and provide immediate visual feedback.
-
To bring to end users at least some of the benefits of formalized notions of testing, without requiring knowledge of testing beyond a naive level.
What is WYSIWYT?
What You See Is What You Test(WYSIWYT) is a visual testing methodology to help end users develop, test and maintain spreadsheets in a manner that does not require an understanding of formal testing theory or the behind the scenes mechanisms.
FEATURES:
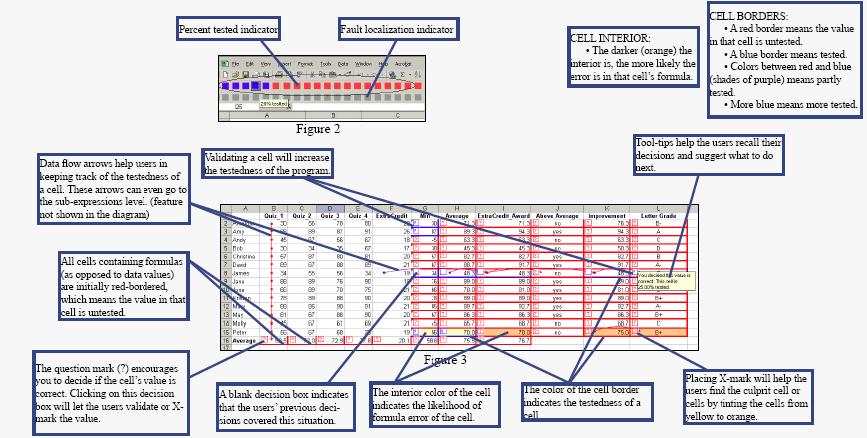
WYSIWYT testedness feedback mechanisms (Figure 3):
• Testing decision boxes (checkboxes)
• Cell border colors
• Data flow arrows
• A percent tested indicator (Figure 2)
Fault localization mechanisms (Figure 3):
• Interior cell colors
• A fault localization indicator (Figure 2)
EMPIRICIAL RESULTS:
Empirical research consistently shows WYSIWYT to be tied to more effectiveness by end users (even without having training on the underlying testing theory). They:
- Debug faster
- Are more likely to test
- Find/fix more reference bugs
- Are less overconfident in spreadsheet correctness
My Contribution
As a summer student researcher in the End-Users Shaping Effective Software (EUSES) consortium, my contributions were small. However, I was involved in quite a few projects that were concerned with the WYSIWYT testing methodology. First of all, I did an oral presentation of the WYSIWYT system to the high school teachers, and prepared handouts and tutorials for them. Then, I was involved in the arrow implementation of the WYSIWYT/Excel prototype. My partner Andrew and I were able to implement curved and straight arrows to show the data dependencies between cells in the Excel spreadsheets. Our arrows also showed the testedness color of those cells. Another contribution was helping a phD student, who had been working on Gender HCI, in collecting data through a study. I also did a one-on-one demo of our WYSIWYT prototypes, both Excel and Forms/3 versions, to a visiting professor. Moreover, I prepared spreadsheet examples for Professor Burnett's presentation at Microsoft and a summary of our project including screen shots for a book written by a professor at OSU. Last but not least, I worked on the journal paper "Empirical Evaluations of WYSIWYT Testing for Spreadsheet Languages". This paper was written two years ago and was needed to be revised according to the three reviewer's comments. It contained the statistical analysis of the three studies conduced at different years. One of the tasks I had to do for this paper was to write summary tables and the following two tables showed the summary of the paper:
| Experiments | Purpose | Sample Characteristics | Spreadsheet Characteristics |
| Experiment 1 (n=78) |
To investigate whether WYSIWYT helps users test effectively | Computer science students from two upper-level undergraduate and one graduate CS course (randomly assigned to the Ad Hoc or WYSIWYT group) |
A numerical and a graphically oriented spreadsheet with no errors |
| Experiment 2 (n=44) |
To investigate whether WYSIWYT testing helps users debug effectively | Computer science students from a senior-level CS course (randomly assigned to the Ad Hoc or WYSIWYT group) | A numerical and a graphically oriented spreadsheet with seeded errors |
| Experiment 3 (n=36) |
To investigate whether WYSIWYT helps users effectively add new features to existing spreadsheets without introducing new errors | Undergraduate business majors experienced with spreadsheet financial models (randomly assigned to the Ad Hoc or WYSIWYT group) | A financial spreadsheet with no errors |
Table 1: A summary table comparing the main features of the three experiments
| Experiments | Results |
| Experiment 1 (n=78) |
Without having training on the underlying testing theory, WYSIWYT users have advantages in testing and judging their own performances |
| Experiment 2 (n=44) |
Without having training on the underlying testing theory, WYSIWYT users have debugging speed and correctness advantages for reference bugs |
| Experiment 3 (n=36) |
Without having training on the underlying testing theory, WYSIWYT users have advantages in testing and judging their own testing performances even though testing does not significantly help their correcting and reducing overconfidence |
Table 2: A summary table of the results for the three experiments
Conclusion
In conclusion, this ten week research experience was very valuable for me. I had learned the process of developing a prototype for research purposes, the process of writing, submitting and revising academic journal papers, the process of collecting data through studies, and above all, most of the processes of academic research. In fact, this experience strengthened my confidence to apply to graduate schools.