Shoshana Neuburger
sneuburg@its.brooklyn.cuny.edu
CRA DMP Experience
Summer 2003

Author
Journal
Homepage
Progress Report
Final Report

Originally, random numbers were generated either manually or mechanically, by using such techniques as spinning wheels, dice rolling, or card shuffling. The modern approach is to use a computer to successively generate pseudorandom numbers. These pseudorandom numbers constitute a sequence of values which, although they are deterministically generated, have all the appearance of being independent uniform (0,1) random variables.
Computer games, medical trials, and stock market simulation all rely on the generation of random numbers. These sequences of numbers are all products of some algorithm; hence, each sequence of numbers can be predicted. These sequences of pseudorandom numbers must be tested extensively to determine whether they mimic hte porperties of truly random numbers needed in the simulation.
We all notice patterns in the numbers we must remember, such as telephone numbers and licenses. Therefore, the human mind alone cannot be trusted to judge whether a sequence of numbers is sufficiently random. Some unbiased mechanical tests must be applied to determine the usefulness of a particular random number generator. The theory of statistics provides us with some quantitative measures for randomness. Various tests compare whether a sequence is truly uniform and uncorrelated, truly a pseudorandom sequence.
The shuffled nested weyl generator was created for the purpose of parallel or distributed calculations. When very large sequences of numbers are generated, it becomes unlikely that the sequences will not overlap. With the additional factor of several processes simultaneously drawing from the same pool of numbers, the parallel sequences often do not seem random at all.
The Equidistribution Test determines that a sequence of numbers is evenly distributed over the interval (0,1). By sorting a fairly large number of samples into bins, and counting the number of observations that fall into each category, we demonstrated that the numbers were distributed evenly over each interval.
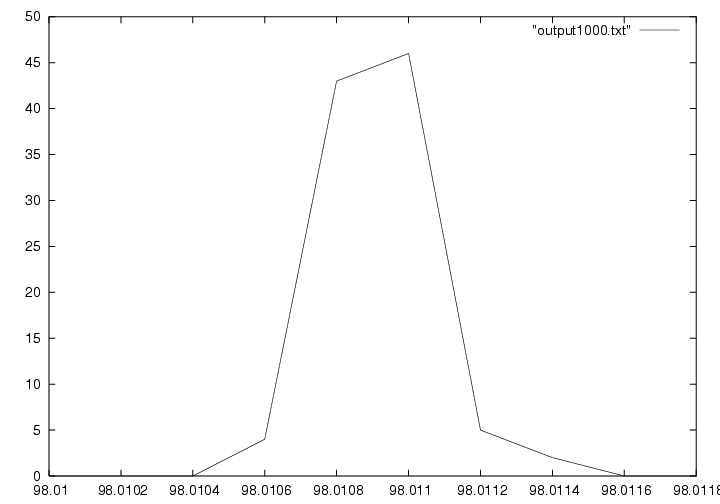
The chi-square test is a basic method that compares the expected behavior to the observed behavior with respect to a hypothesis. other tests. Performing the chi-square test on the results of the equidistribution test demonstrated that the distribution is within the expected range. Sorting many chi-square distributions and plotting the values based on their frequency revealed that the numbers are satisfactorily random with respect to this test. Figure 1 shows the plot of 1,000 chi-sqare distributions, each performed on 10,000 sorted samples.

The Kolmogorov-Smironov (KS) test is based on the difference between the theoretical and actual values of the cumulative probability distribution function for the test it is applied to, at different points. We applied the KS test to the Equidistribution Test results. A fairly large number of KS calculations were obtained and the KS test was applied again to these results. This method of using several tests for moderately large numbers of samples, then combining the observations later in another KS test, tends to detect both local and global nonrandom behavior.