K-Nearest Neighbor


Relevant Links:
Emily
Research Home
My Journal
On Another Note
Clustering Methods and Analyses:

KNN Clustering

K-Median Clustering

Kaplan-Meier Estimation

Top Genes based on Variance

Cross-Validation

Significant Genes

K-Nearest Neighbor


Basic Ideas Behind KNN Clustering Method Employed The Harvard Dataset My Results Future Plans

Basic Ideas Behind KNN Clustering:

Back to Top


The goal of this clustering method is to simply seperate the data based on the assumed similarties between various classes. Thus, the classes can be differentiated from one another by searching for similarities between the data provided.


Method Employed:

Back to Top


KNN was first introduced by the researchers E. Fix and J. Hodges in their paper, Discriminatory Analysis: Nonparametric Discrimination: Consistency Properties, in 1951.

A distance is assigned between all points in a dataset. Distance is defined as the Euclidean distance between two points or:
d(x,y)=sqrt((x1-y1)^2+(x2-y2)^2+...+(xn-yn)^2)
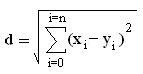
From these distances, a distance matrix is constructed between all possible pairings of points (x, y).

Each data point within the data set has a class label in the set, C={c1,...,cn}.

The data points', k-closest neighbors (k being the number of neighbors) are then found by analyzing the distance matrix. The k-closest data points are then analyzed to determine which class label is the most common amoung the set. The most common class label is then assigned to the data point being analyzed.

In the case where two or more class labels occur an equal number of times for a specific data point within the dataset, the KNN test is run on K-1 (one less neighbor) of the data point in question. This is a recursive process. If there is again a tie between classes, KNN is run on K-2. This continues in the instance of a tie until K=1. When K=1 there is only one class represented in the outcome and thus there can be no tie.

These resulting class labels are used to classify each data point in the data set.


The Harvard Dataset:

Back to Top


The Harvard Dataset can be found on the CAMDA website, at www.camda.duke.edu/camda03/contest.asp. It contained five distinct tumor groups: adenocarcinomas (AD), squamous (SQ), cartoid (COID), SMLC, and normal lung (NL). There were approximately 200 tumors within the dataset, for each of which, 12,600 genes were analyzed.


My Results:

Back to Top


When I ran KNN on the Harvard dataset, the data was classified to varying degrees of correctness depending on the number of neighbors (k) chosen.

kPercentage Correct
ADSQCOIDSMLCNLTotal
192.1%61.9%95.0%83.3%100%89.7%
292.1%61.9%95.0%83.3%100%89.7%
396.4%66.7%95.0%83.3%94.1%92.6%
496.4%66.7%95.0%83.3%94.1%92.6%
597.1%66.7%95.0%50.0%94.1%92.1%
697.1%66.7%95.0%50.0%94.1%92.1%
797.1%57.1%95.0%33.3%94.1%90.6%
897.1%57.1%95.0%33.3%94.1%90.6%
997.1%57.1%95.0%33.3%94.1%89.7%

Thus, it can be seen that the greatest accuracy was obtained while using either at least k=4.


This program was also tested using cross-validation. For the fivefold cross-validation the results were as follows:

kPercentage Correct
ADSQCOIDSMLCNLTotal
192.1%57.1%95.0%66.7%100%88.7%
395.7%66.7%95.0%66.7%94.1%91.6%
597.1%61.9%95.0%50.0%94.1%92.1%
997.8%52.4%95.0%0.00%88.2%89.2%


Future Plans:

Back to Top


This will be put aside for some time while I attempt to discover if my clusters from the K-Median Clustering are related to survival.


Questions or Comments?
Email Me! Emily K. Mower